Stock Analysis
- India
- /
- Wireless Telecom
- /
- NSEI:BHARTIARTL
Bharti Airtel's (NSE:BHARTIARTL) investors will be pleased with their enviable 309% return over the last five years


The most you can lose on any stock (assuming you don't use leverage) is 100% of your money. But on the bright side, you can make far more than 100% on a really good stock. One great example is Bharti Airtel Limited (NSE:BHARTIARTL) which saw its share price drive 297% higher over five years. It's also good to see the share price up 18% over the last quarter. This could be related to the recent financial results, released recently - you can catch up on the most recent data by reading our company report.
So let's investigate and see if the longer term performance of the company has been in line with the underlying business' progress.
Check out our latest analysis for Bharti Airtel
While markets are a powerful pricing mechanism, share prices reflect investor sentiment, not just underlying business performance. One imperfect but simple way to consider how the market perception of a company has shifted is to compare the change in the earnings per share (EPS) with the share price movement.
During the five years of share price growth, Bharti Airtel moved from a loss to profitability. That kind of transition can be an inflection point that justifies a strong share price gain, just as we have seen here.
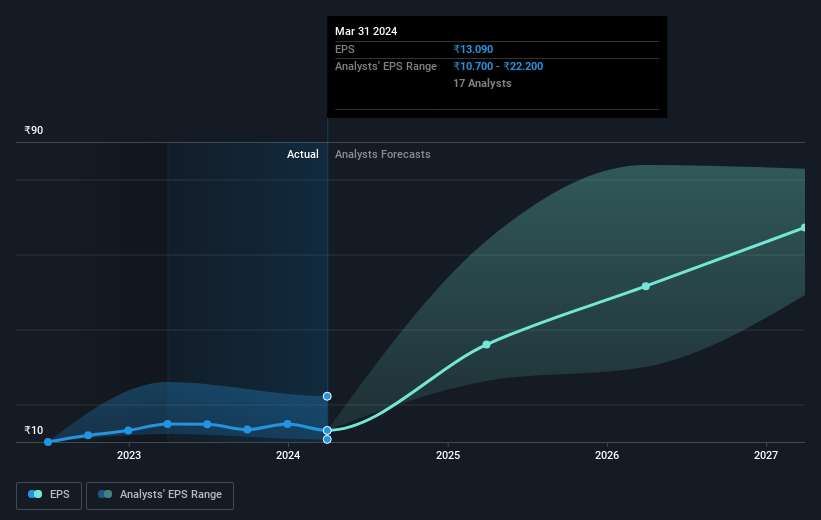
You can see below how EPS has changed over time (discover the exact values by clicking on the image).
It is of course excellent to see how Bharti Airtel has grown profits over the years, but the future is more important for shareholders. Take a more thorough look at Bharti Airtel's financial health with this free report on its balance sheet.
What About Dividends?
As well as measuring the share price return, investors should also consider the total shareholder return (TSR). The TSR is a return calculation that accounts for the value of cash dividends (assuming that any dividend received was reinvested) and the calculated value of any discounted capital raisings and spin-offs. Arguably, the TSR gives a more comprehensive picture of the return generated by a stock. In the case of Bharti Airtel, it has a TSR of 309% for the last 5 years. That exceeds its share price return that we previously mentioned. This is largely a result of its dividend payments!
A Different Perspective
It's good to see that Bharti Airtel has rewarded shareholders with a total shareholder return of 69% in the last twelve months. And that does include the dividend. That gain is better than the annual TSR over five years, which is 33%. Therefore it seems like sentiment around the company has been positive lately. Given the share price momentum remains strong, it might be worth taking a closer look at the stock, lest you miss an opportunity. I find it very interesting to look at share price over the long term as a proxy for business performance. But to truly gain insight, we need to consider other information, too. Consider for instance, the ever-present spectre of investment risk. We've identified 3 warning signs with Bharti Airtel (at least 1 which is a bit unpleasant) , and understanding them should be part of your investment process.
We will like Bharti Airtel better if we see some big insider buys. While we wait, check out this free list of undervalued stocks (mostly small caps) with considerable, recent, insider buying.
Please note, the market returns quoted in this article reflect the market weighted average returns of stocks that currently trade on Indian exchanges.
Valuation is complex, but we're helping make it simple.
Find out whether Bharti Airtel is potentially over or undervalued by checking out our comprehensive analysis, which includes fair value estimates, risks and warnings, dividends, insider transactions and financial health.
View the Free AnalysisHave feedback on this article? Concerned about the content? Get in touch with us directly. Alternatively, email editorial-team (at) simplywallst.com.
This article by Simply Wall St is general in nature. We provide commentary based on historical data and analyst forecasts only using an unbiased methodology and our articles are not intended to be financial advice. It does not constitute a recommendation to buy or sell any stock, and does not take account of your objectives, or your financial situation. We aim to bring you long-term focused analysis driven by fundamental data. Note that our analysis may not factor in the latest price-sensitive company announcements or qualitative material. Simply Wall St has no position in any stocks mentioned.
About NSEI:BHARTIARTL
Bharti Airtel
Operates as a telecommunications company in Asia and Africa.
High growth potential average dividend payer.
