- India
- /
- Communications
- /
- NSEI:STLTECH
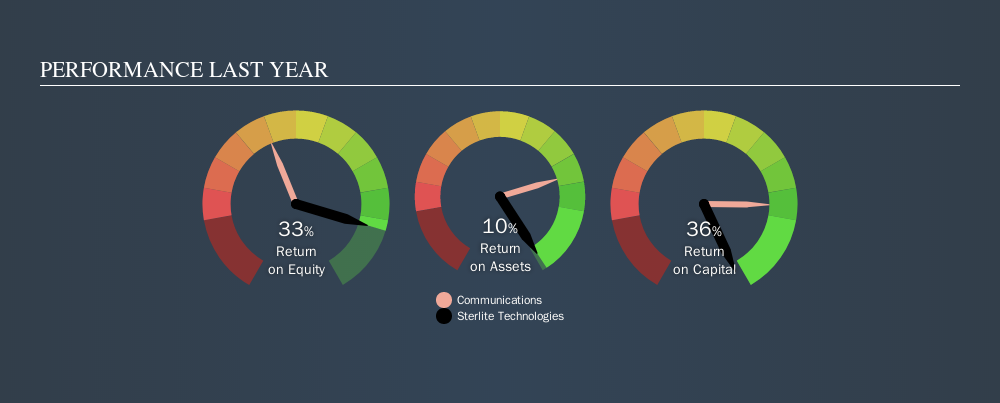
Sterlite Technologies Limited (NSE:STRTECH) Is Employing Capital Very Effectively

Today we are going to look at Sterlite Technologies Limited (NSE:STRTECH) to see whether it might be an attractive investment prospect. Specifically, we're going to calculate its Return On Capital Employed (ROCE), in the hopes of getting some insight into the business.
First up, we'll look at what ROCE is and how we calculate it. Second, we'll look at its ROCE compared to similar companies. Last but not least, we'll look at what impact its current liabilities have on its ROCE.
Return On Capital Employed (ROCE): What is it?
ROCE is a metric for evaluating how much pre-tax income (in percentage terms) a company earns on the capital invested in its business. In general, businesses with a higher ROCE are usually better quality. Ultimately, it is a useful but imperfect metric. Author Edwin Whiting says to be careful when comparing the ROCE of different businesses, since 'No two businesses are exactly alike.
So, How Do We Calculate ROCE?
The formula for calculating the return on capital employed is:
Return on Capital Employed = Earnings Before Interest and Tax (EBIT) ÷ (Total Assets - Current Liabilities)
Or for Sterlite Technologies:
0.36 = ₹10b ÷ (₹70b - ₹41b) (Based on the trailing twelve months to June 2019.)
So, Sterlite Technologies has an ROCE of 36%.
View our latest analysis for Sterlite Technologies
Is Sterlite Technologies's ROCE Good?
When making comparisons between similar businesses, investors may find ROCE useful. Using our data, we find that Sterlite Technologies's ROCE is meaningfully better than the 13% average in the Communications industry. We would consider this a positive, as it suggests it is using capital more effectively than other similar companies. Putting aside its position relative to its industry for now, in absolute terms, Sterlite Technologies's ROCE is currently very good.
In our analysis, Sterlite Technologies's ROCE appears to be 36%, compared to 3 years ago, when its ROCE was 23%. This makes us wonder if the company is improving. The image below shows how Sterlite Technologies's ROCE compares to its industry.
It is important to remember that ROCE shows past performance, and is not necessarily predictive. ROCE can be misleading for companies in cyclical industries, with returns looking impressive during the boom times, but very weak during the busts. ROCE is, after all, simply a snap shot of a single year. What happens in the future is pretty important for investors, so we have prepared a free report on analyst forecasts for Sterlite Technologies.
Do Sterlite Technologies's Current Liabilities Skew Its ROCE?
Liabilities, such as supplier bills and bank overdrafts, are referred to as current liabilities if they need to be paid within 12 months. Due to the way the ROCE equation works, having large bills due in the near term can make it look as though a company has less capital employed, and thus a higher ROCE than usual. To counteract this, we check if a company has high current liabilities, relative to its total assets.
Sterlite Technologies has total assets of ₹70b and current liabilities of ₹41b. As a result, its current liabilities are equal to approximately 59% of its total assets. Sterlite Technologies's high level of current liabilities boost the ROCE - but its ROCE is still impressive.
The Bottom Line On Sterlite Technologies's ROCE
So we would be interested in doing more research here -- there may be an opportunity! Sterlite Technologies looks strong on this analysis, but there are plenty of other companies that could be a good opportunity . Here is a free list of companies growing earnings rapidly.
For those who like to find winning investments this free list of growing companies with recent insider purchasing, could be just the ticket.
We aim to bring you long-term focused research analysis driven by fundamental data. Note that our analysis may not factor in the latest price-sensitive company announcements or qualitative material.
If you spot an error that warrants correction, please contact the editor at editorial-team@simplywallst.com. This article by Simply Wall St is general in nature. It does not constitute a recommendation to buy or sell any stock, and does not take account of your objectives, or your financial situation. Simply Wall St has no position in the stocks mentioned. Thank you for reading.
About NSEI:STLTECH
Sterlite Technologies
Manufactures and sells telecom products in India and internationally.
Reasonable growth potential and fair value.
Similar Companies
Market Insights

Weekly Picks

Early mover in a fast growing industry. Likely to experience share price volatility as they scale


A case for CA$31.80 (undiluted), aka 8,616% upside from CA$0.37 (an 86 bagger!).


Moderation and Stabilisation: HOLD: Fair Price based on a 4-year Cycle is $12.08
Recently Updated Narratives

Airbnb Stock: Platform Growth in a World of Saturation and Scrutiny

Adobe Stock: AI-Fueled ARR Growth Pushes Guidance Higher, But Cost Pressures Loom

Thomson Reuters Stock: When Legal Intelligence Becomes Mission-Critical Infrastructure
Popular Narratives


Crazy Undervalued 42 Baggers Silver Play (Active & Running Mine)


NVDA: Expanding AI Demand Will Drive Major Data Center Investments Through 2026

The AI Infrastructure Giant Grows Into Its Valuation
Trending Discussion


