Advertisement
- India
- /
- Oil and Gas
- /
- NSEI:BPCL
Top 3 Indian Dividend Stocks To Boost Your Portfolio

Simply Wall St
Reviewed by Simply Wall St
In the last week, the Indian market has stayed flat, though the Utilities sector saw a notable gain of 4.5%. With the market up 45% over the past year and earnings forecast to grow by 17% annually, selecting dividend stocks with strong fundamentals can be a strategic way to boost your portfolio in these conditions.
Top 10 Dividend Stocks In India
| Name | Dividend Yield | Dividend Rating |
| Balmer Lawrie Investments (BSE:532485) | 3.41% | ★★★★★★ |
| D. B (NSEI:DBCORP) | 5.02% | ★★★★★☆ |
| HCL Technologies (NSEI:HCLTECH) | 3.23% | ★★★★★☆ |
| VST Industries (BSE:509966) | 3.50% | ★★★★★☆ |
| Indian Oil (NSEI:IOC) | 7.90% | ★★★★★☆ |
| Bharat Petroleum (NSEI:BPCL) | 6.05% | ★★★★★☆ |
| NMDC (BSE:526371) | 3.07% | ★★★★★☆ |
| Redington (NSEI:REDINGTON) | 3.06% | ★★★★★☆ |
| Bank of Baroda (NSEI:BANKBARODA) | 3.12% | ★★★★★☆ |
| PTC India (NSEI:PTC) | 3.58% | ★★★★★☆ |
Click here to see the full list of 17 stocks from our Top Indian Dividend Stocks screener.
Here we highlight a subset of our preferred stocks from the screener.
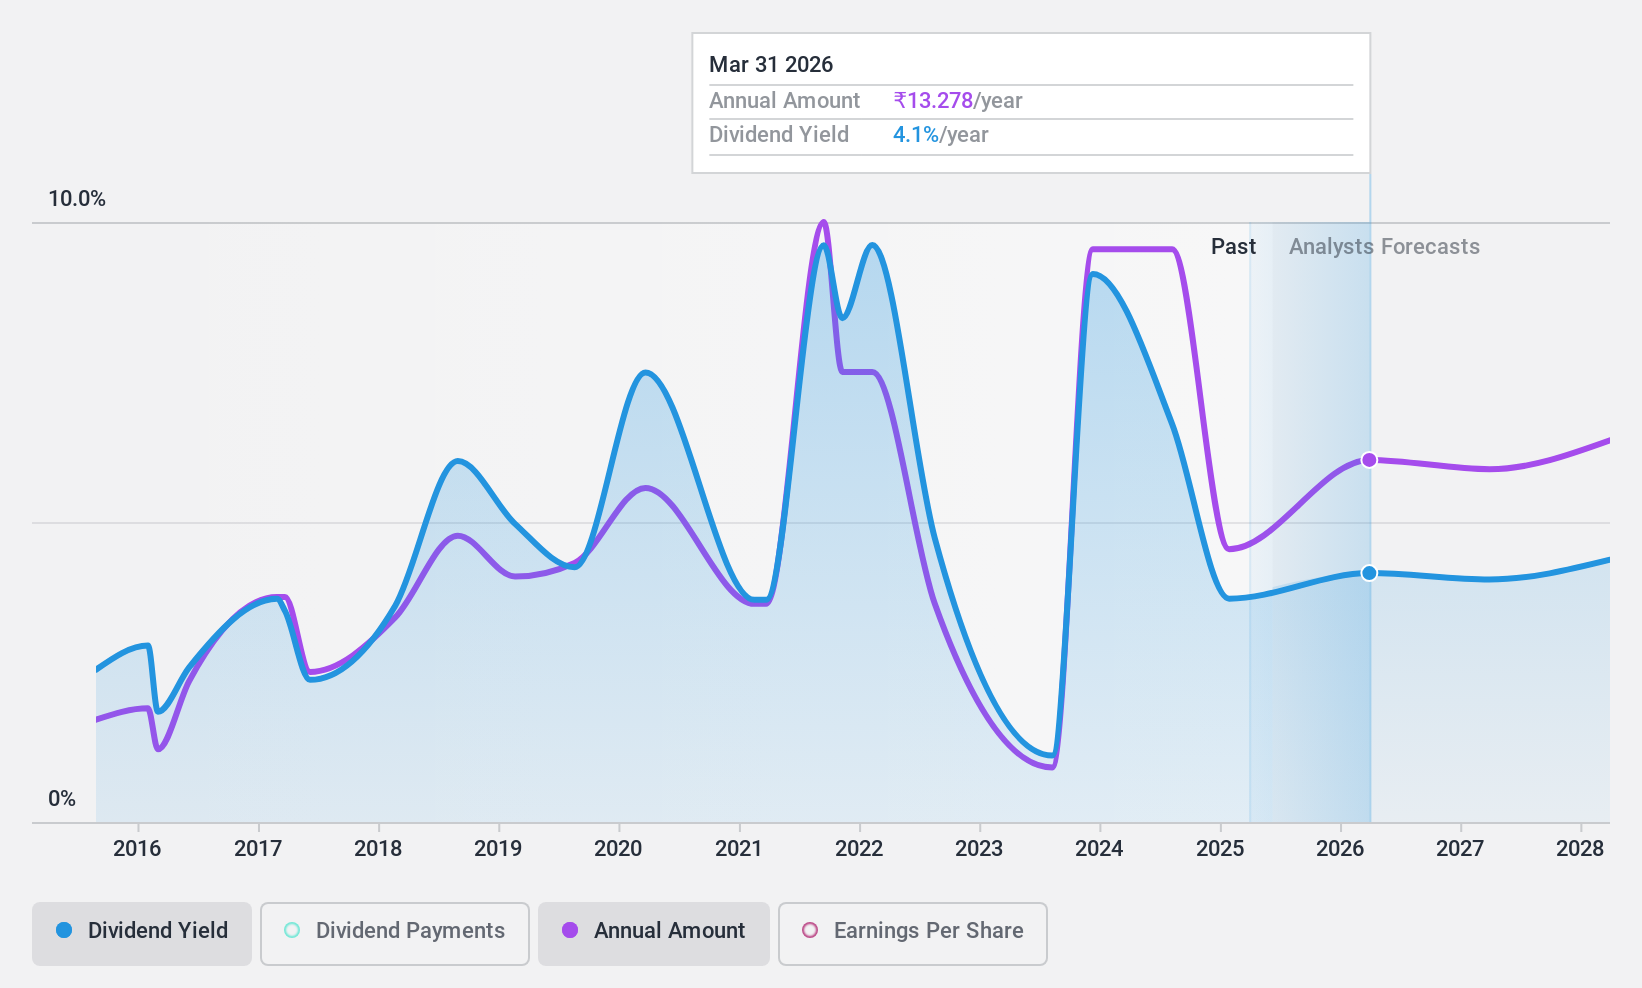
Bharat Petroleum (NSEI:BPCL)
Simply Wall St Dividend Rating: ★★★★★☆
Overview: Bharat Petroleum Corporation Limited refines crude oil and markets petroleum products in India, with a market cap of ₹1.51 trillion.
Operations: Bharat Petroleum Corporation Limited generates revenue primarily from its Downstream Petroleum segment (₹5.07 billion) and also engages in the Exploration & Production of Hydrocarbons (₹1.92 million).
Dividend Yield: 6.1%
Bharat Petroleum's dividend payments have been volatile over the past decade, despite a low payout ratio of 33.3% and strong earnings coverage. The company trades at a favorable P/E ratio of 7.9x compared to the Indian market average, but its high debt level and forecasted earnings decline by 12.8% annually for the next three years raise concerns about future dividend sustainability. Recent Q1 financials showed a significant drop in net income to ₹28.42 billion from ₹106.44 billion year-over-year.
- Click to explore a detailed breakdown of our findings in Bharat Petroleum's dividend report.
- Our valuation report unveils the possibility Bharat Petroleum's shares may be trading at a discount.
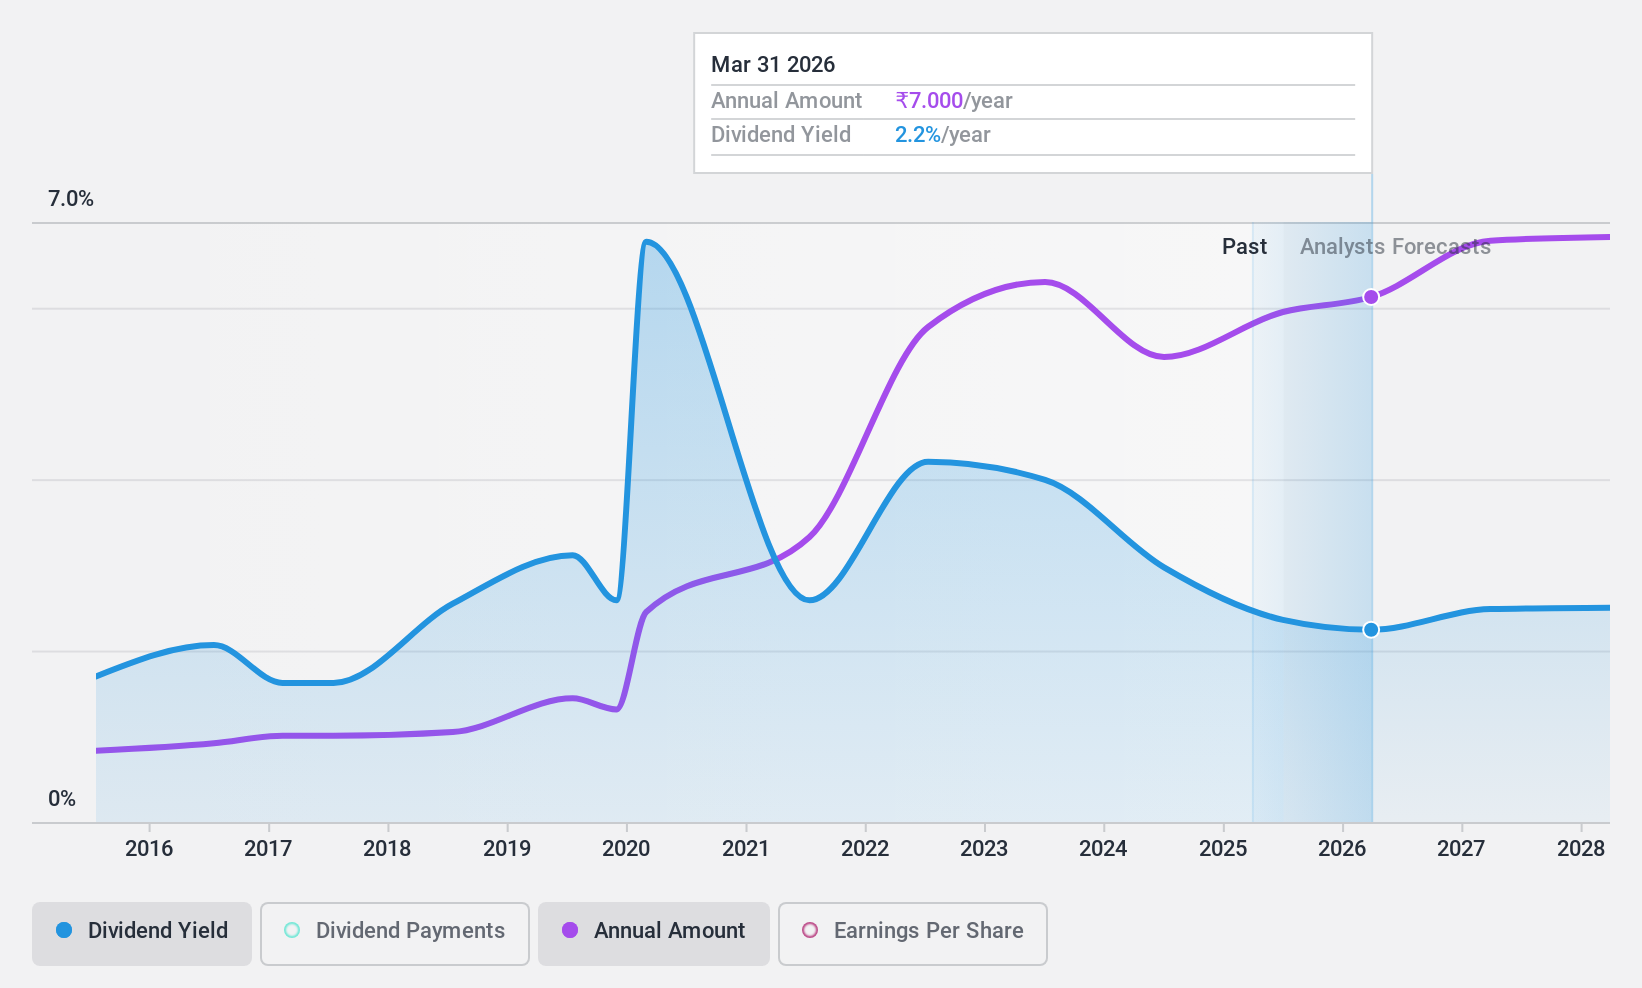
Redington (NSEI:REDINGTON)
Simply Wall St Dividend Rating: ★★★★★☆
Overview: Redington Limited offers supply chain solutions both in India and internationally, with a market cap of ₹158.33 billion.
Operations: Redington Limited generates revenue through its supply chain solutions provided across various sectors in India and globally.
Dividend Yield: 3.1%
Redington's dividend yield of 3.06% ranks in the top 25% of Indian dividend payers, with payments increasing over the past decade despite some volatility. The company's payout ratios—39.8% for earnings and 50.6% for cash flows—indicate sustainable dividends. Trading at a P/E ratio of 13x, below the market average, it offers good value relative to peers. Recent AGM announcements included a dividend declaration of ₹6.20 per share and an increase in authorized share capital.
- Unlock comprehensive insights into our analysis of Redington stock in this dividend report.
- Our valuation report here indicates Redington may be undervalued.
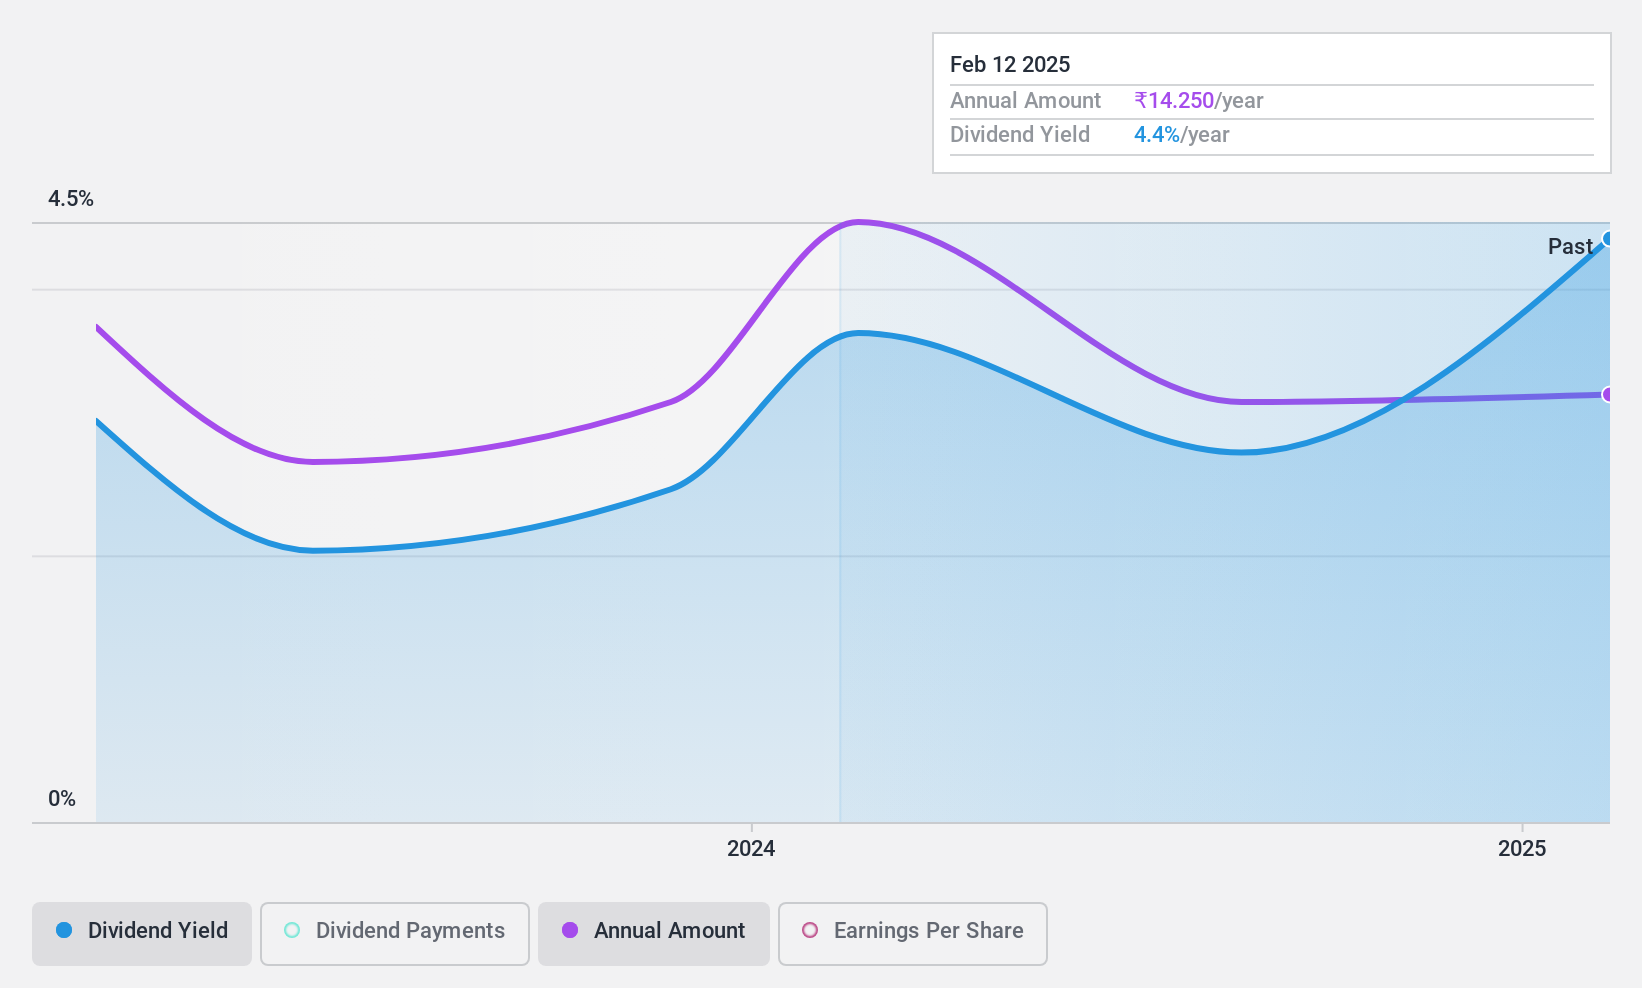
Uniparts India (NSEI:UNIPARTS)
Simply Wall St Dividend Rating: ★★★★☆☆
Overview: Uniparts India Limited, with a market cap of ₹22.61 billion, manufactures and sells engineering systems, solutions, assemblies, and components primarily for off-highway vehicles across India and various international markets including the United States, Asia Pacific, Europe, and Japan.
Operations: Uniparts India Limited generates revenue of ₹11.40 billion from its Linkage Parts and Components for Off-Highway Vehicles segment.
Dividend Yield: 3.9%
Uniparts India's dividend yield of 3.9% places it in the top 25% of Indian dividend payers, though its track record is too brief to assess reliability or growth. The payout ratios—62.6% for earnings and 53.9% for cash flows—suggest dividends are sustainable despite recent declines in revenue and net income (₹11.49 billion and ₹1.25 billion, respectively). Trading at a P/E ratio of 18.1x, below the market average, it presents good relative value amid industry peers.
- Navigate through the intricacies of Uniparts India with our comprehensive dividend report here.
- In light of our recent valuation report, it seems possible that Uniparts India is trading behind its estimated value.
Where To Now?
- Dive into all 17 of the Top Indian Dividend Stocks we have identified here.
- Are these companies part of your investment strategy? Use Simply Wall St to consolidate your holdings into a portfolio and gain insights with our comprehensive analysis tools.
- Simply Wall St is a revolutionary app designed for long-term stock investors, it's free and covers every market in the world.
Seeking Other Investments?
- Explore high-performing small cap companies that haven't yet garnered significant analyst attention.
- Fuel your portfolio with companies showing strong growth potential, backed by optimistic outlooks both from analysts and management.
- Find companies with promising cash flow potential yet trading below their fair value.
This article by Simply Wall St is general in nature. We provide commentary based on historical data and analyst forecasts only using an unbiased methodology and our articles are not intended to be financial advice. It does not constitute a recommendation to buy or sell any stock, and does not take account of your objectives, or your financial situation. We aim to bring you long-term focused analysis driven by fundamental data. Note that our analysis may not factor in the latest price-sensitive company announcements or qualitative material. Simply Wall St has no position in any stocks mentioned.
Valuation is complex, but we're here to simplify it.
Discover if Bharat Petroleum might be undervalued or overvalued with our detailed analysis, featuring fair value estimates, potential risks, dividends, insider trades, and its financial condition.
Access Free AnalysisHave feedback on this article? Concerned about the content? Get in touch with us directly. Alternatively, email editorial-team@simplywallst.com
About NSEI:BPCL
Bharat Petroleum
Engages in refining crude oil and marketing petroleum products in India and internationally.
Outstanding track record with excellent balance sheet and pays a dividend.
Similar Companies
Market Insights

Advertisement
Community Narratives
The company that turned a verb into a global necessity and basically runs the modern internet, digital ads, smartphones, maps, and AI.
Fair Value US$300.00|5.2% undervalued
OS
Community Contributor
Flowers Foods Pays A Fair Price For Health
Fair Value US$16.12|24.9% undervalued
NV
Community Contributor
TMX Group will thrive with 33.3% profit margin and enduring market moat
Fair Value CA$49.90|3.3% overvalued
LI
Community Contributor
The "Molecular Pencil": Why Beam's Technology is Built to Win
Fair Value US$65.01|64.5% undervalued
DA
Community Contributor