
Advertisement
David Iben put it well when he said, 'Volatility is not a risk we care about. What we care about is avoiding the permanent loss of capital.' So it might be obvious that you need to consider debt, when you think about how risky any given stock is, because too much debt can sink a company. Importantly, Nelco Limited (NSE:NELCO) does carry debt. But should shareholders be worried about its use of debt?
What Risk Does Debt Bring?
Generally speaking, debt only becomes a real problem when a company can't easily pay it off, either by raising capital or with its own cash flow. If things get really bad, the lenders can take control of the business. However, a more usual (but still expensive) situation is where a company must dilute shareholders at a cheap share price simply to get debt under control. By replacing dilution, though, debt can be an extremely good tool for businesses that need capital to invest in growth at high rates of return. When we think about a company's use of debt, we first look at cash and debt together.
View our latest analysis for Nelco
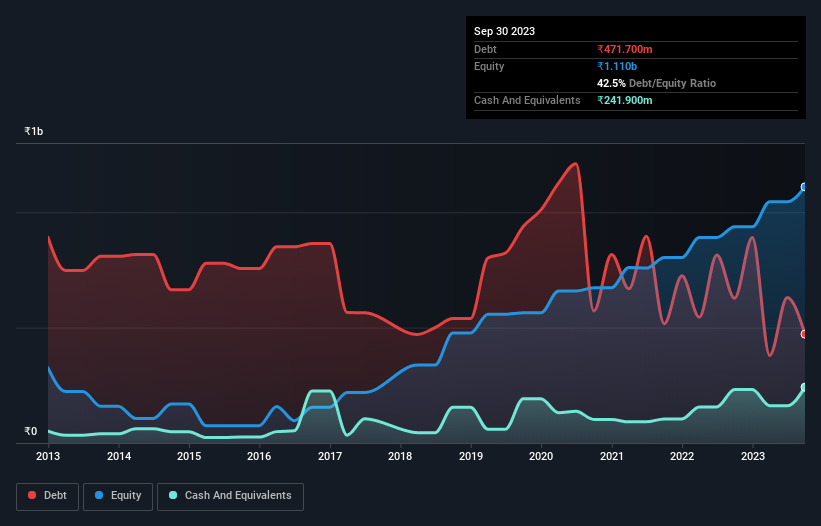
What Is Nelco's Net Debt?
As you can see below, Nelco had ₹471.7m of debt at September 2023, down from ₹627.5m a year prior. However, because it has a cash reserve of ₹241.9m, its net debt is less, at about ₹229.8m.
How Healthy Is Nelco's Balance Sheet?
The latest balance sheet data shows that Nelco had liabilities of ₹1.35b due within a year, and liabilities of ₹339.7m falling due after that. Offsetting this, it had ₹241.9m in cash and ₹901.0m in receivables that were due within 12 months. So its liabilities outweigh the sum of its cash and (near-term) receivables by ₹545.4m.
Given Nelco has a market capitalization of ₹16.1b, it's hard to believe these liabilities pose much threat. But there are sufficient liabilities that we would certainly recommend shareholders continue to monitor the balance sheet, going forward. Carrying virtually no net debt, Nelco has a very light debt load indeed.
We use two main ratios to inform us about debt levels relative to earnings. The first is net debt divided by earnings before interest, tax, depreciation, and amortization (EBITDA), while the second is how many times its earnings before interest and tax (EBIT) covers its interest expense (or its interest cover, for short). Thus we consider debt relative to earnings both with and without depreciation and amortization expenses.
Looking at its net debt to EBITDA of 0.42 and interest cover of 5.7 times, it seems to us that Nelco is probably using debt in a pretty reasonable way. So we'd recommend keeping a close eye on the impact financing costs are having on the business. Also relevant is that Nelco has grown its EBIT by a very respectable 21% in the last year, thus enhancing its ability to pay down debt. The balance sheet is clearly the area to focus on when you are analysing debt. But you can't view debt in total isolation; since Nelco will need earnings to service that debt. So when considering debt, it's definitely worth looking at the earnings trend. Click here for an interactive snapshot.
But our final consideration is also important, because a company cannot pay debt with paper profits; it needs cold hard cash. So the logical step is to look at the proportion of that EBIT that is matched by actual free cash flow. Over the last three years, Nelco recorded free cash flow worth a fulsome 98% of its EBIT, which is stronger than we'd usually expect. That positions it well to pay down debt if desirable to do so.
Our View
Happily, Nelco's impressive conversion of EBIT to free cash flow implies it has the upper hand on its debt. And that's just the beginning of the good news since its net debt to EBITDA is also very heartening. Looking at the bigger picture, we think Nelco's use of debt seems quite reasonable and we're not concerned about it. After all, sensible leverage can boost returns on equity. Over time, share prices tend to follow earnings per share, so if you're interested in Nelco, you may well want to click here to check an interactive graph of its earnings per share history.
If you're interested in investing in businesses that can grow profits without the burden of debt, then check out this free list of growing businesses that have net cash on the balance sheet.
Valuation is complex, but we're here to simplify it.
Discover if Nelco might be undervalued or overvalued with our detailed analysis, featuring fair value estimates, potential risks, dividends, insider trades, and its financial condition.
Access Free AnalysisHave feedback on this article? Concerned about the content? Get in touch with us directly. Alternatively, email editorial-team (at) simplywallst.com.
This article by Simply Wall St is general in nature. We provide commentary based on historical data and analyst forecasts only using an unbiased methodology and our articles are not intended to be financial advice. It does not constitute a recommendation to buy or sell any stock, and does not take account of your objectives, or your financial situation. We aim to bring you long-term focused analysis driven by fundamental data. Note that our analysis may not factor in the latest price-sensitive company announcements or qualitative material. Simply Wall St has no position in any stocks mentioned.
About NSEI:NELCO
Nelco
Provides solutions in the areas of very small aperture terminals (VSAT) connectivity, satellite communication (Satcom) projects, and integrated security and surveillance solutions in India.
Excellent balance sheet with low risk.
Similar Companies
Market Insights

Advertisement
Community Narratives
Finding The True Value Of A Logistics Powerhouse
Fair Value US$95.21|8.6% undervalued
NV
Community Contributor
Paradigm Biopharmaceuticals Will Lead Osteoarthritis Treatment with Zilosul's FDA Success
Fair Value AU$5.50|91.9% undervalued
AM
Community Contributor
Barrick Mining (ABX:CA): A Gold Hedge against a U.S. Shutdown
Fair Value CA$60.00|25.6% undervalued
GM
Community Contributor