
Advertisement
- India
- /
- Electronic Equipment and Components
- /
- NSEI:KAYNES
Kaynes Technology India Limited's (NSE:KAYNES) Stock Has Been Sliding But Fundamentals Look Strong: Is The Market Wrong?

Kaynes Technology India (NSE:KAYNES) has had a rough month with its share price down 6.0%. However, a closer look at its sound financials might cause you to think again. Given that fundamentals usually drive long-term market outcomes, the company is worth looking at. Particularly, we will be paying attention to Kaynes Technology India's ROE today.
ROE or return on equity is a useful tool to assess how effectively a company can generate returns on the investment it received from its shareholders. Simply put, it is used to assess the profitability of a company in relation to its equity capital.
Check out our latest analysis for Kaynes Technology India
How Do You Calculate Return On Equity?
The formula for return on equity is:
Return on Equity = Net Profit (from continuing operations) ÷ Shareholders' Equity
So, based on the above formula, the ROE for Kaynes Technology India is:
14% = ₹1.4b ÷ ₹10b (Based on the trailing twelve months to December 2023).
The 'return' is the yearly profit. That means that for every ₹1 worth of shareholders' equity, the company generated ₹0.14 in profit.
What Has ROE Got To Do With Earnings Growth?
So far, we've learned that ROE is a measure of a company's profitability. Based on how much of its profits the company chooses to reinvest or "retain", we are then able to evaluate a company's future ability to generate profits. Assuming all else is equal, companies that have both a higher return on equity and higher profit retention are usually the ones that have a higher growth rate when compared to companies that don't have the same features.
A Side By Side comparison of Kaynes Technology India's Earnings Growth And 14% ROE
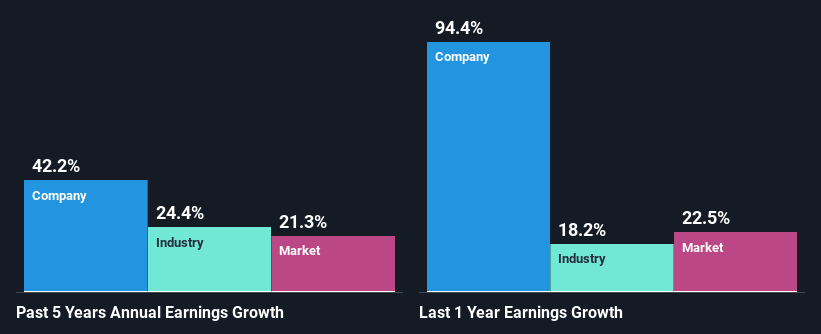
On the face of it, Kaynes Technology India's ROE is not much to talk about. Although a closer study shows that the company's ROE is higher than the industry average of 11% which we definitely can't overlook. Especially when you consider Kaynes Technology India's exceptional 42% net income growth over the past five years. Bear in mind, the company does have a moderately low ROE. It is just that the industry ROE is lower. So, there might well be other reasons for the earnings to grow. E.g the company has a low payout ratio or could belong to a high growth industry.
As a next step, we compared Kaynes Technology India's net income growth with the industry, and pleasingly, we found that the growth seen by the company is higher than the average industry growth of 24%.
The basis for attaching value to a company is, to a great extent, tied to its earnings growth. It’s important for an investor to know whether the market has priced in the company's expected earnings growth (or decline). This then helps them determine if the stock is placed for a bright or bleak future. If you're wondering about Kaynes Technology India's's valuation, check out this gauge of its price-to-earnings ratio, as compared to its industry.
Is Kaynes Technology India Efficiently Re-investing Its Profits?
Kaynes Technology India doesn't pay any regular dividends to its shareholders, meaning that the company has been reinvesting all of its profits into the business. This is likely what's driving the high earnings growth number discussed above.
Summary
Overall, we are quite pleased with Kaynes Technology India's performance. In particular, it's great to see that the company has seen significant growth in its earnings backed by a respectable ROE and a high reinvestment rate. That being so, a study of the latest analyst forecasts show that the company is expected to see a slowdown in its future earnings growth. To know more about the company's future earnings growth forecasts take a look at this free report on analyst forecasts for the company to find out more.
Valuation is complex, but we're here to simplify it.
Discover if Kaynes Technology India might be undervalued or overvalued with our detailed analysis, featuring fair value estimates, potential risks, dividends, insider trades, and its financial condition.
Access Free AnalysisHave feedback on this article? Concerned about the content? Get in touch with us directly. Alternatively, email editorial-team (at) simplywallst.com.
This article by Simply Wall St is general in nature. We provide commentary based on historical data and analyst forecasts only using an unbiased methodology and our articles are not intended to be financial advice. It does not constitute a recommendation to buy or sell any stock, and does not take account of your objectives, or your financial situation. We aim to bring you long-term focused analysis driven by fundamental data. Note that our analysis may not factor in the latest price-sensitive company announcements or qualitative material. Simply Wall St has no position in any stocks mentioned.
About NSEI:KAYNES
Kaynes Technology India
Operates as an end-to-end and IoT solutions-enabled integrated electronics manufacturer in India and internationally.
High growth potential with excellent balance sheet.
Similar Companies
Market Insights


Advertisement
Community Narratives
A case for TSXV:USA to reach USD $5.00 - $9.00 (CAD $7.30–$12.29) by 2029.
Fair Value CA$12.29|91.2% undervalued
AG
Community Contributor
DLocal's Future Growth Fueled by 35% Revenue and Profit Margin Boosts
Fair Value US$195.39|94.1% undervalued
WY
Community Contributor
Historically Cheap, but the Margin of Safety Is Still Thin
Fair Value SEK 232.58|12.7% undervalued
MA
Community Contributor