Advertisement
Legendary fund manager Li Lu (who Charlie Munger backed) once said, 'The biggest investment risk is not the volatility of prices, but whether you will suffer a permanent loss of capital.' It's only natural to consider a company's balance sheet when you examine how risky it is, since debt is often involved when a business collapses. We can see that Tridhya Tech Limited (NSE:TRIDHYA) does use debt in its business. But is this debt a concern to shareholders?
Why Does Debt Bring Risk?
Generally speaking, debt only becomes a real problem when a company can't easily pay it off, either by raising capital or with its own cash flow. Ultimately, if the company can't fulfill its legal obligations to repay debt, shareholders could walk away with nothing. However, a more common (but still painful) scenario is that it has to raise new equity capital at a low price, thus permanently diluting shareholders. Of course, the upside of debt is that it often represents cheap capital, especially when it replaces dilution in a company with the ability to reinvest at high rates of return. When we think about a company's use of debt, we first look at cash and debt together.
What Is Tridhya Tech's Debt?
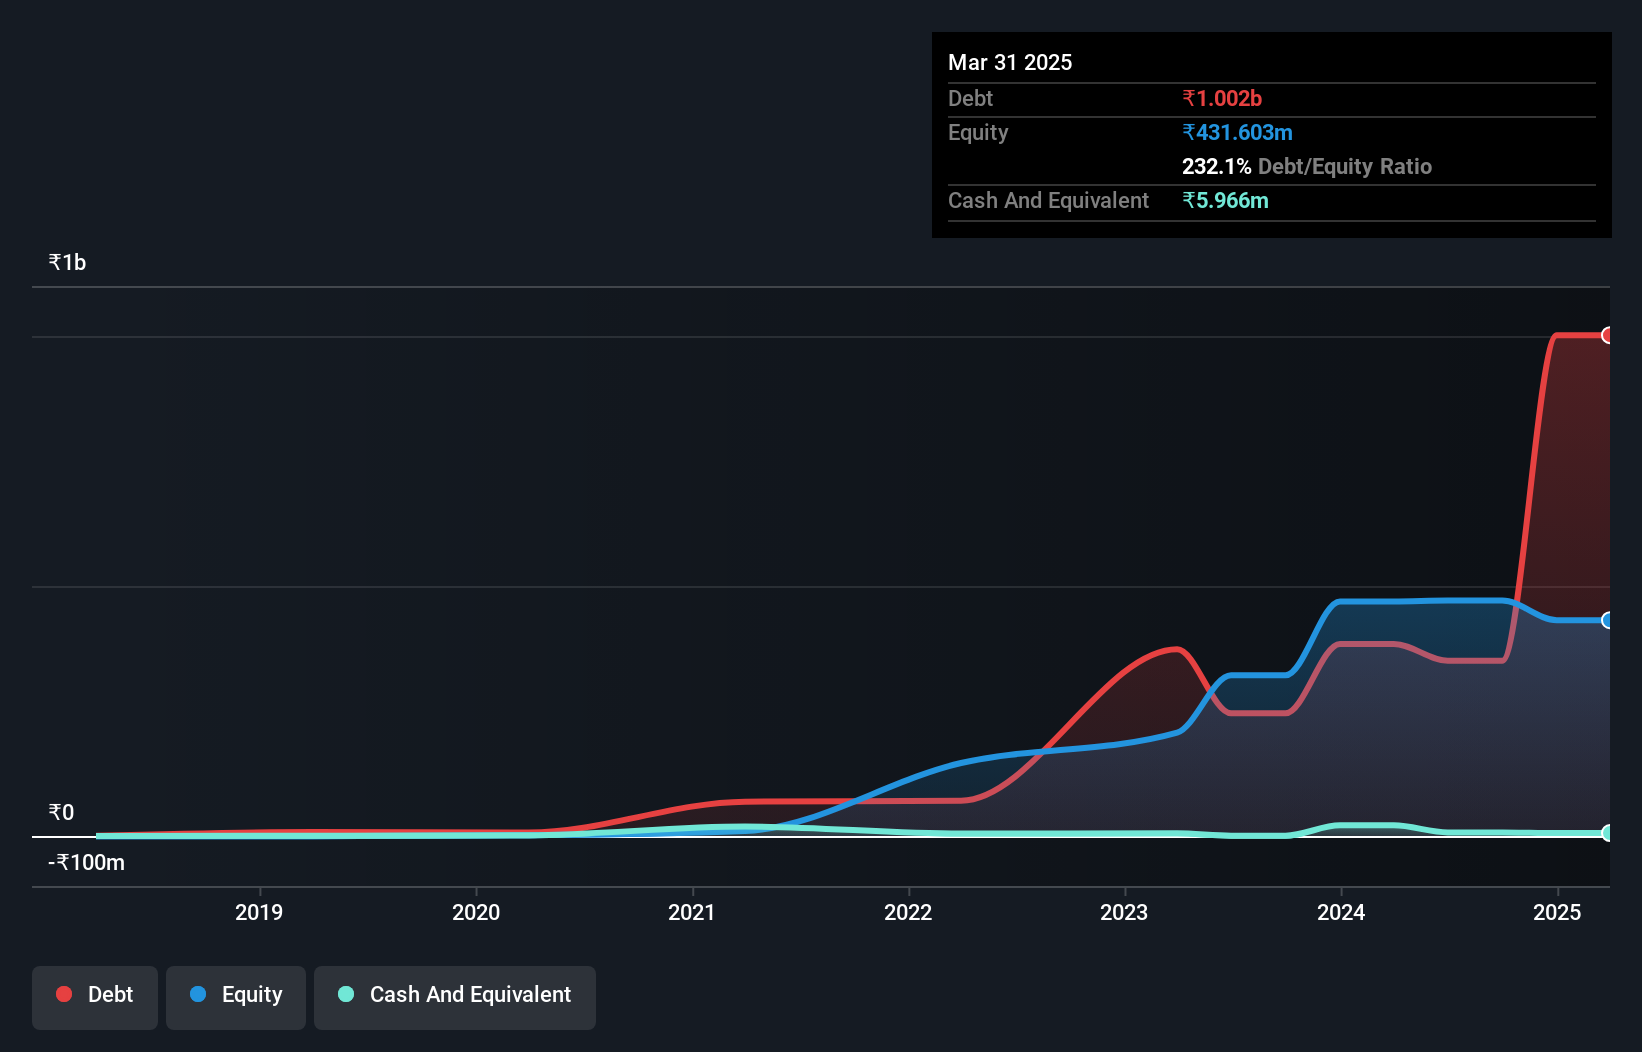
As you can see below, at the end of March 2025, Tridhya Tech had ₹1.00b of debt, up from ₹384.1m a year ago. Click the image for more detail. And it doesn't have much cash, so its net debt is about the same.
How Healthy Is Tridhya Tech's Balance Sheet?
Zooming in on the latest balance sheet data, we can see that Tridhya Tech had liabilities of ₹858.6m due within 12 months and liabilities of ₹213.5m due beyond that. Offsetting this, it had ₹5.97m in cash and ₹723.0m in receivables that were due within 12 months. So its liabilities total ₹343.2m more than the combination of its cash and short-term receivables.
This is a mountain of leverage relative to its market capitalization of ₹404.0m. Should its lenders demand that it shore up the balance sheet, shareholders would likely face severe dilution. When analysing debt levels, the balance sheet is the obvious place to start. But you can't view debt in total isolation; since Tridhya Tech will need earnings to service that debt. So if you're keen to discover more about its earnings, it might be worth checking out this graph of its long term earnings trend.
View our latest analysis for Tridhya Tech
In the last year Tridhya Tech's revenue was pretty flat, and it made a negative EBIT. While that's not too bad, we'd prefer see growth.
Caveat Emptor
Importantly, Tridhya Tech had an earnings before interest and tax (EBIT) loss over the last year. Indeed, it lost a very considerable ₹43m at the EBIT level. Considering that alongside the liabilities mentioned above does not give us much confidence that company should be using so much debt. So we think its balance sheet is a little strained, though not beyond repair. For example, we would not want to see a repeat of last year's loss of ₹36m. In the meantime, we consider the stock very risky. There's no doubt that we learn most about debt from the balance sheet. However, not all investment risk resides within the balance sheet - far from it. To that end, you should learn about the 5 warning signs we've spotted with Tridhya Tech (including 2 which are a bit unpleasant) .
Of course, if you're the type of investor who prefers buying stocks without the burden of debt, then don't hesitate to discover our exclusive list of net cash growth stocks, today.
Valuation is complex, but we're here to simplify it.
Discover if Tridhya Tech might be undervalued or overvalued with our detailed analysis, featuring fair value estimates, potential risks, dividends, insider trades, and its financial condition.
Access Free AnalysisHave feedback on this article? Concerned about the content? Get in touch with us directly. Alternatively, email editorial-team (at) simplywallst.com.
This article by Simply Wall St is general in nature. We provide commentary based on historical data and analyst forecasts only using an unbiased methodology and our articles are not intended to be financial advice. It does not constitute a recommendation to buy or sell any stock, and does not take account of your objectives, or your financial situation. We aim to bring you long-term focused analysis driven by fundamental data. Note that our analysis may not factor in the latest price-sensitive company announcements or qualitative material. Simply Wall St has no position in any stocks mentioned.
About NSEI:TRIDHYA
Tridhya Tech
Provides full-service software development services in India and internationally.
Adequate balance sheet with slight risk.
Market Insights


Advertisement
Weekly Picks
CE


Ceazar on Sparc AI ·
When GPS fails: this small cap is fixing a $54B drone problem
Fair Value:CA$5.2542.9% undervalued
64 followersusers have followed this narrative
0 commentsusers have commented on this narrative
17 likesusers have liked this narrative
HE


HedgeY on IonQ ·
The Best-Funded Quantum Platform and Still a Stock Priced for Perfection
Fair Value:US$487.1% overvalued
24 followersusers have followed this narrative
0 commentsusers have commented on this narrative
4 likesusers have liked this narrative
BL


BlackGoat on Cerebras Systems ·
The Wafer Giant Threatening NVIDIA's GPU Hegemony
Fair Value:US$415.5446.8% undervalued
40 followersusers have followed this narrative
1 commentusers have commented on this narrative
7 likesusers have liked this narrative
IV

Ivoed on Netflix ·
Netflix’s Business Quality Is Clear. The Harder Question Is Whether The Stock Is Still Cheap
Fair Value:US$829.5% undervalued
23 followersusers have followed this narrative
0 commentsusers have commented on this narrative
8 likesusers have liked this narrative
Recently Updated Narratives
BR

Bravosatya on Meta Platforms ·
Meta Platforms - Zuckerberg’s investment decisions are impulsive or Prudent?
Fair Value:US$730.0216.0% undervalued
2 followersusers have followed this narrative
0 commentsusers have commented on this narrative
0 likesusers have liked this narrative
JU

julio on FIGS ·
Figs valuation
Fair Value:US$14.3930.2% undervalued
20 followersusers have followed this narrative
6 commentsusers have commented on this narrative
0 likesusers have liked this narrative
AS


AstrisCorporateAdvisory on MIRAI ·
Improving NOI growth visibility on wider rent gap
Fair Value:JP¥77.06k46.1% undervalued
1 followerusers have followed this narrative
0 commentsusers have commented on this narrative
0 likesusers have liked this narrative
Popular Narratives
IN


Investingwilly on Mastercard ·
Mastercard: The Best Dividend Stock You're Ignoring
Fair Value:US$75030.3% undervalued
80 followersusers have followed this narrative
1 commentusers have commented on this narrative
9 likesusers have liked this narrative
HA


HarishPK on Adobe ·
Adobe: A Probabilistic Case for Undervaluation
Fair Value:US$319.9634.1% undervalued
62 followersusers have followed this narrative
9 commentsusers have commented on this narrative
19 likesusers have liked this narrative
MA


martinarauz on Nu Holdings ·
Investment Analysis (May 2026)
Fair Value:US$22.7441.1% undervalued
68 followersusers have followed this narrative
0 commentsusers have commented on this narrative
17 likesusers have liked this narrative