Advertisement
These 4 Measures Indicate That Trident Techlabs (NSE:TECHLABS) Is Using Debt Reasonably Well
Warren Buffett famously said, 'Volatility is far from synonymous with risk.' When we think about how risky a company is, we always like to look at its use of debt, since debt overload can lead to ruin. Importantly, Trident Techlabs Limited (NSE:TECHLABS) does carry debt. But the real question is whether this debt is making the company risky.
Why Does Debt Bring Risk?
Generally speaking, debt only becomes a real problem when a company can't easily pay it off, either by raising capital or with its own cash flow. Part and parcel of capitalism is the process of 'creative destruction' where failed businesses are mercilessly liquidated by their bankers. However, a more common (but still painful) scenario is that it has to raise new equity capital at a low price, thus permanently diluting shareholders. By replacing dilution, though, debt can be an extremely good tool for businesses that need capital to invest in growth at high rates of return. The first step when considering a company's debt levels is to consider its cash and debt together.
See our latest analysis for Trident Techlabs
What Is Trident Techlabs's Net Debt?
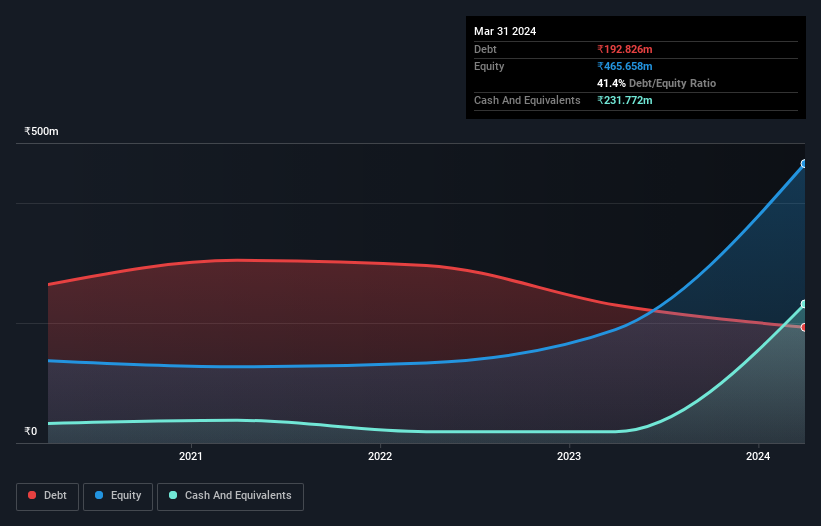
As you can see below, Trident Techlabs had ₹192.8m of debt at March 2024, down from ₹230.0m a year prior. But on the other hand it also has ₹231.8m in cash, leading to a ₹38.9m net cash position.
A Look At Trident Techlabs' Liabilities
The latest balance sheet data shows that Trident Techlabs had liabilities of ₹386.1m due within a year, and liabilities of ₹136.6m falling due after that. Offsetting this, it had ₹231.8m in cash and ₹629.5m in receivables that were due within 12 months. So it can boast ₹338.5m more liquid assets than total liabilities.
This surplus suggests that Trident Techlabs has a conservative balance sheet, and could probably eliminate its debt without much difficulty. Succinctly put, Trident Techlabs boasts net cash, so it's fair to say it does not have a heavy debt load!
It is well worth noting that Trident Techlabs's EBIT shot up like bamboo after rain, gaining 68% in the last twelve months. That'll make it easier to manage its debt. The balance sheet is clearly the area to focus on when you are analysing debt. But you can't view debt in total isolation; since Trident Techlabs will need earnings to service that debt. So if you're keen to discover more about its earnings, it might be worth checking out this graph of its long term earnings trend.
Finally, while the tax-man may adore accounting profits, lenders only accept cold hard cash. Trident Techlabs may have net cash on the balance sheet, but it is still interesting to look at how well the business converts its earnings before interest and tax (EBIT) to free cash flow, because that will influence both its need for, and its capacity to manage debt. Over the last three years, Trident Techlabs saw substantial negative free cash flow, in total. While investors are no doubt expecting a reversal of that situation in due course, it clearly does mean its use of debt is more risky.
Summing Up
While we empathize with investors who find debt concerning, you should keep in mind that Trident Techlabs has net cash of ₹38.9m, as well as more liquid assets than liabilities. And we liked the look of last year's 68% year-on-year EBIT growth. So we are not troubled with Trident Techlabs's debt use. The balance sheet is clearly the area to focus on when you are analysing debt. But ultimately, every company can contain risks that exist outside of the balance sheet. We've identified 2 warning signs with Trident Techlabs (at least 1 which doesn't sit too well with us) , and understanding them should be part of your investment process.
If, after all that, you're more interested in a fast growing company with a rock-solid balance sheet, then check out our list of net cash growth stocks without delay.
Valuation is complex, but we're here to simplify it.
Discover if Trident Techlabs might be undervalued or overvalued with our detailed analysis, featuring fair value estimates, potential risks, dividends, insider trades, and its financial condition.
Access Free AnalysisHave feedback on this article? Concerned about the content? Get in touch with us directly. Alternatively, email editorial-team (at) simplywallst.com.
This article by Simply Wall St is general in nature. We provide commentary based on historical data and analyst forecasts only using an unbiased methodology and our articles are not intended to be financial advice. It does not constitute a recommendation to buy or sell any stock, and does not take account of your objectives, or your financial situation. We aim to bring you long-term focused analysis driven by fundamental data. Note that our analysis may not factor in the latest price-sensitive company announcements or qualitative material. Simply Wall St has no position in any stocks mentioned.
About NSEI:TECHLABS
Trident Techlabs
A technology company, provides engineering and power system solutions in India.
Flawless balance sheet second-rate dividend payer.
Market Insights


Advertisement
Weekly Picks
LO


Lou_Basenese on Giftify ·
Giftify ($GIFT): A Small-Cap Incentives Platform with More ScaleThan Its Valuation Suggests
Fair Value:US$2.563.5% undervalued
49 followersusers have followed this narrative
2 commentsusers have commented on this narrative
9 likesusers have liked this narrative
HA


HarishPK on lululemon athletica ·
Quantifying the Transition: Why Lululemon’s Moat Remains Intact
Fair Value:US$161.826.3% undervalued
21 followersusers have followed this narrative
2 commentsusers have commented on this narrative
9 likesusers have liked this narrative
TR


tripledub on Alphabet ·
Warren Buffett Just Bet $10 Billion on Google. The Catch? You May Already Be Too Late.
Fair Value:US$23055.3% overvalued
53 followersusers have followed this narrative
1 commentusers have commented on this narrative
13 likesusers have liked this narrative
JO


John_Eric on Veeva Systems ·
AI-Powered Veeva Systems Poised for Solid Growth Amid Regulatory Stability
Fair Value:US$32040.6% undervalued
31 followersusers have followed this narrative
0 commentsusers have commented on this narrative
5 likesusers have liked this narrative
Recently Updated Narratives
LI

Lijo on Accenture ·
A value stock that's undervalued.
Fair Value:US$18326.1% undervalued
3 followersusers have followed this narrative
0 commentsusers have commented on this narrative
0 likesusers have liked this narrative
RO


RockeTeller on Rox Resources ·
Developer to Producer: Debt-Free Path, A$965M Post-Tax NPV, and Massive Gold Leverage
Fair Value:AU$6.1693.3% undervalued
8 followersusers have followed this narrative
0 commentsusers have commented on this narrative
1 likeusers have liked this narrative
JO

John_Eric on MercadoLibre ·
MercadoLibre and the Spreadsheet Trick That Decides Everything
Fair Value:US$4.72k60.8% undervalued
1 followerusers have followed this narrative
0 commentsusers have commented on this narrative
0 likesusers have liked this narrative
Popular Narratives
IN


Investingwilly on Mastercard ·
Mastercard: The Best Dividend Stock You're Ignoring
Fair Value:US$75029.8% undervalued
86 followersusers have followed this narrative
1 commentusers have commented on this narrative
9 likesusers have liked this narrative
BL


BlackGoat on Cerebras Systems ·
The Wafer Giant Threatening NVIDIA's GPU Hegemony
Fair Value:US$415.5448.2% undervalued
60 followersusers have followed this narrative
3 commentsusers have commented on this narrative
11 likesusers have liked this narrative
HE


HedgeY on Quanta Services ·
The Picks-and-Shovels Leader of the Grid Supercycle
Fair Value:US$7107.2% undervalued
53 followersusers have followed this narrative
0 commentsusers have commented on this narrative
6 likesusers have liked this narrative

