
Advertisement
Does The Market Have A Low Tolerance For Subex Limited's (NSE:SUBEXLTD) Mixed Fundamentals?
With its stock down 35% over the past three months, it is easy to disregard Subex (NSE:SUBEXLTD). We, however decided to study the company's financials to determine if they have got anything to do with the price decline. Stock prices are usually driven by a company’s financial performance over the long term, and therefore we decided to pay more attention to the company's financial performance. Particularly, we will be paying attention to Subex's ROE today.
Return on Equity or ROE is a test of how effectively a company is growing its value and managing investors’ money. In simpler terms, it measures the profitability of a company in relation to shareholder's equity.
See our latest analysis for Subex
How Do You Calculate Return On Equity?
The formula for return on equity is:
Return on Equity = Net Profit (from continuing operations) ÷ Shareholders' Equity
So, based on the above formula, the ROE for Subex is:
6.5% = ₹360m ÷ ₹5.6b (Based on the trailing twelve months to December 2021).
The 'return' is the yearly profit. Another way to think of that is that for every ₹1 worth of equity, the company was able to earn ₹0.06 in profit.
Why Is ROE Important For Earnings Growth?
So far, we've learned that ROE is a measure of a company's profitability. We now need to evaluate how much profit the company reinvests or "retains" for future growth which then gives us an idea about the growth potential of the company. Generally speaking, other things being equal, firms with a high return on equity and profit retention, have a higher growth rate than firms that don’t share these attributes.
Subex's Earnings Growth And 6.5% ROE
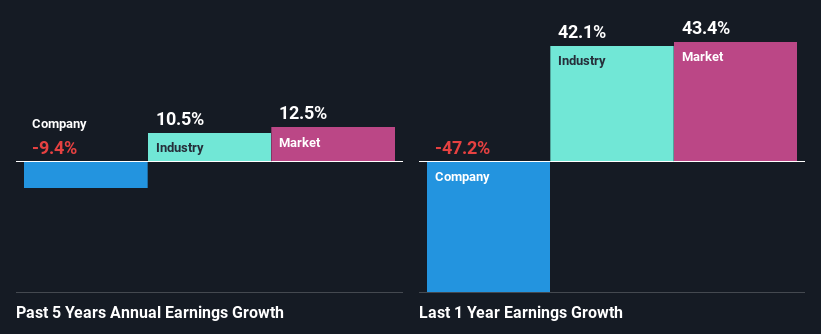
It is quite clear that Subex's ROE is rather low. Even compared to the average industry ROE of 13%, the company's ROE is quite dismal. Given the circumstances, the significant decline in net income by 9.4% seen by Subex over the last five years is not surprising. We reckon that there could also be other factors at play here. Such as - low earnings retention or poor allocation of capital.
So, as a next step, we compared Subex's performance against the industry and were disappointed to discover that while the company has been shrinking its earnings, the industry has been growing its earnings at a rate of 11% in the same period.
The basis for attaching value to a company is, to a great extent, tied to its earnings growth. It’s important for an investor to know whether the market has priced in the company's expected earnings growth (or decline). This then helps them determine if the stock is placed for a bright or bleak future. If you're wondering about Subex's's valuation, check out this gauge of its price-to-earnings ratio, as compared to its industry.
Is Subex Efficiently Re-investing Its Profits?
Despite having a normal three-year median payout ratio of 38% (where it is retaining 62% of its profits), Subex has seen a decline in earnings as we saw above. So there might be other factors at play here which could potentially be hampering growth. For example, the business has faced some headwinds.
Additionally, Subex started paying a dividend only recently. So it looks like the management may have perceived that shareholders favor dividends even though earnings have been in decline.
Summary
On the whole, we feel that the performance shown by Subex can be open to many interpretations. While the company does have a high rate of profit retention, its low rate of return is probably hampering its earnings growth. Wrapping up, we would proceed with caution with this company and one way of doing that would be to look at the risk profile of the business. To know the 4 risks we have identified for Subex visit our risks dashboard for free.
New: Manage All Your Stock Portfolios in One Place
We've created the ultimate portfolio companion for stock investors, and it's free.
• Connect an unlimited number of Portfolios and see your total in one currency
• Be alerted to new Warning Signs or Risks via email or mobile
• Track the Fair Value of your stocks
Have feedback on this article? Concerned about the content? Get in touch with us directly. Alternatively, email editorial-team (at) simplywallst.com.
This article by Simply Wall St is general in nature. We provide commentary based on historical data and analyst forecasts only using an unbiased methodology and our articles are not intended to be financial advice. It does not constitute a recommendation to buy or sell any stock, and does not take account of your objectives, or your financial situation. We aim to bring you long-term focused analysis driven by fundamental data. Note that our analysis may not factor in the latest price-sensitive company announcements or qualitative material. Simply Wall St has no position in any stocks mentioned.
About NSEI:SUBEXLTD
Subex
Provides operations and business support systems to communication service providers (CSPs) worldwide.
Flawless balance sheet and good value.
Market Insights

Advertisement
Community Narratives
MicroVision will explode future revenue by 380.37% with a vision towards success
Fair Value US$60.00|98.4% undervalued
TH
Community Contributor
The Indispensable Artery for a New North American Economy
Fair Value CA$132.87|1.3% undervalued
TI
Community Contributor