Advertisement
SoftTech Engineers Limited (NSE:SOFTTECH) Might Not Be As Mispriced As It Looks
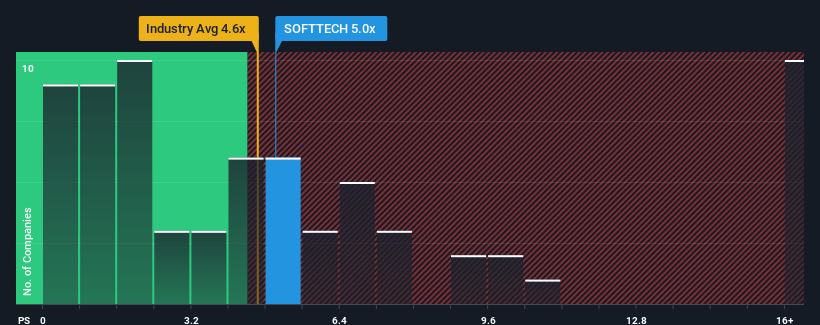
With a median price-to-sales (or "P/S") ratio of close to 4.6x in the Software industry in India, you could be forgiven for feeling indifferent about SoftTech Engineers Limited's (NSE:SOFTTECH) P/S ratio of 5x. Although, it's not wise to simply ignore the P/S without explanation as investors may be disregarding a distinct opportunity or a costly mistake.
View our latest analysis for SoftTech Engineers
How SoftTech Engineers Has Been Performing
Revenue has risen firmly for SoftTech Engineers recently, which is pleasing to see. It might be that many expect the respectable revenue performance to wane, which has kept the P/S from rising. Those who are bullish on SoftTech Engineers will be hoping that this isn't the case, so that they can pick up the stock at a lower valuation.
Although there are no analyst estimates available for SoftTech Engineers, take a look at this free data-rich visualisation to see how the company stacks up on earnings, revenue and cash flow.Is There Some Revenue Growth Forecasted For SoftTech Engineers?
The only time you'd be comfortable seeing a P/S like SoftTech Engineers' is when the company's growth is tracking the industry closely.
If we review the last year of revenue growth, the company posted a terrific increase of 16%. The strong recent performance means it was also able to grow revenue by 67% in total over the last three years. So we can start by confirming that the company has done a great job of growing revenue over that time.
This is in contrast to the rest of the industry, which is expected to grow by 16% over the next year, materially lower than the company's recent medium-term annualised growth rates.
With this information, we find it interesting that SoftTech Engineers is trading at a fairly similar P/S compared to the industry. It may be that most investors are not convinced the company can maintain its recent growth rates.
What Does SoftTech Engineers' P/S Mean For Investors?
We'd say the price-to-sales ratio's power isn't primarily as a valuation instrument but rather to gauge current investor sentiment and future expectations.
To our surprise, SoftTech Engineers revealed its three-year revenue trends aren't contributing to its P/S as much as we would have predicted, given they look better than current industry expectations. When we see strong revenue with faster-than-industry growth, we can only assume potential risks are what might be placing pressure on the P/S ratio. At least the risk of a price drop looks to be subdued if recent medium-term revenue trends continue, but investors seem to think future revenue could see some volatility.
And what about other risks? Every company has them, and we've spotted 2 warning signs for SoftTech Engineers (of which 1 makes us a bit uncomfortable!) you should know about.
Of course, profitable companies with a history of great earnings growth are generally safer bets. So you may wish to see this free collection of other companies that have reasonable P/E ratios and have grown earnings strongly.
New: Manage All Your Stock Portfolios in One Place
We've created the ultimate portfolio companion for stock investors, and it's free.
• Connect an unlimited number of Portfolios and see your total in one currency
• Be alerted to new Warning Signs or Risks via email or mobile
• Track the Fair Value of your stocks
Have feedback on this article? Concerned about the content? Get in touch with us directly. Alternatively, email editorial-team (at) simplywallst.com.
This article by Simply Wall St is general in nature. We provide commentary based on historical data and analyst forecasts only using an unbiased methodology and our articles are not intended to be financial advice. It does not constitute a recommendation to buy or sell any stock, and does not take account of your objectives, or your financial situation. We aim to bring you long-term focused analysis driven by fundamental data. Note that our analysis may not factor in the latest price-sensitive company announcements or qualitative material. Simply Wall St has no position in any stocks mentioned.
About NSEI:SOFTTECH
SoftTech Engineers
Develops software products and solutions for the architecture, engineering, operations, and construction sectors in India and internationally.
Excellent balance sheet with proven track record.
Similar Companies
Market Insights

Advertisement
Weekly Picks
DA


davidlsander on Nevgold ·
The U.S. Government Is Desperate for This Metal. This Tiny Miner Has It -- Its Closest Peer Is Already Worth Double.
Fair Value:US$2.1944.7% undervalued
25 followersusers have followed this narrative
0 commentsusers have commented on this narrative
2 likesusers have liked this narrative
BE

benjamin_lvieq on PayPal Holdings ·
PayPal: PayPal Doesn't Need to Grow – It Needs to Stop Falling – A Mispriced Cash Machine With a Cannibal Buyback
Fair Value:US$6512.7% undervalued
58 followersusers have followed this narrative
2 commentsusers have commented on this narrative
9 likesusers have liked this narrative
JD

JD009 on Celsius Holdings ·
From $5M to $2B: Why the 2024 Crash Was the Best Buying Opportunity in Consumer Stocks
Fair Value:US$55.4345.9% undervalued
19 followersusers have followed this narrative
1 commentusers have commented on this narrative
8 likesusers have liked this narrative
WA

Wavefarer on Accenture ·
High-quality global services company facing an AI-driven valuation reset.
Fair Value:US$30152.0% undervalued
16 followersusers have followed this narrative
0 commentsusers have commented on this narrative
5 likesusers have liked this narrative
Recently Updated Narratives
RI

Ricktorious on IREN ·
IREN: AI Infrastructure Growth vs. Valuation Risk
Fair Value:US$120.0771.0% undervalued
3 followersusers have followed this narrative
0 commentsusers have commented on this narrative
0 likesusers have liked this narrative
BL

BlackGoat on IREN ·
IREN's Bold Moves in Sustainable Bitcoin Mining & AI Data Centers
Fair Value:US$71.4851.3% undervalued
200 followersusers have followed this narrative
16 commentsusers have commented on this narrative
0 likesusers have liked this narrative
RD

rdiab on Fortinet ·
FTNT Is The Cybersecurity Powerhouse A Buy?
Fair Value:US$125.5628.1% overvalued
1 followerusers have followed this narrative
0 commentsusers have commented on this narrative
0 likesusers have liked this narrative
Popular Narratives
IN


Investingwilly on Mastercard ·
Mastercard: The Best Dividend Stock You're Ignoring
Fair Value:US$75026.5% undervalued
94 followersusers have followed this narrative
1 commentusers have commented on this narrative
9 likesusers have liked this narrative
BL

BlackGoat on Cerebras Systems ·
The Wafer Giant Threatening NVIDIA's GPU Hegemony
Fair Value:US$415.5456.6% undervalued
63 followersusers have followed this narrative
3 commentsusers have commented on this narrative
11 likesusers have liked this narrative
BE
benjamin_lvieq on PayPal Holdings ·
PayPal: PayPal Doesn't Need to Grow – It Needs to Stop Falling – A Mispriced Cash Machine With a Cannibal Buyback
Fair Value:US$6512.7% undervalued
58 followersusers have followed this narrative
2 commentsusers have commented on this narrative
9 likesusers have liked this narrative
Trending Discussion
ST


StoxEurope on Koninklijke Ahold Delhaize ·
I ran Ahold Delhaize through a three-model triangulation — DCF, dividend discount, and residual inco...
1
|0
BE
benjamin_lvieq on PayPal Holdings ·
An investment case is not about loving the product. Its about price vs reality.
1
|0