Declining Stock and Solid Fundamentals: Is The Market Wrong About Sigma Solve Limited (NSE:SIGMA)?

Sigma Solve (NSE:SIGMA) has had a rough week with its share price down 12%. However, stock prices are usually driven by a company’s financial performance over the long term, which in this case looks quite promising. Specifically, we decided to study Sigma Solve's ROE in this article.
Return on equity or ROE is a key measure used to assess how efficiently a company's management is utilizing the company's capital. In simpler terms, it measures the profitability of a company in relation to shareholder's equity.
See our latest analysis for Sigma Solve
How To Calculate Return On Equity?
Return on equity can be calculated by using the formula:
Return on Equity = Net Profit (from continuing operations) ÷ Shareholders' Equity
So, based on the above formula, the ROE for Sigma Solve is:
29% = ₹176m ÷ ₹618m (Based on the trailing twelve months to December 2023).
The 'return' is the income the business earned over the last year. Another way to think of that is that for every ₹1 worth of equity, the company was able to earn ₹0.29 in profit.
What Has ROE Got To Do With Earnings Growth?
So far, we've learned that ROE is a measure of a company's profitability. Depending on how much of these profits the company reinvests or "retains", and how effectively it does so, we are then able to assess a company’s earnings growth potential. Generally speaking, other things being equal, firms with a high return on equity and profit retention, have a higher growth rate than firms that don’t share these attributes.
Sigma Solve's Earnings Growth And 29% ROE
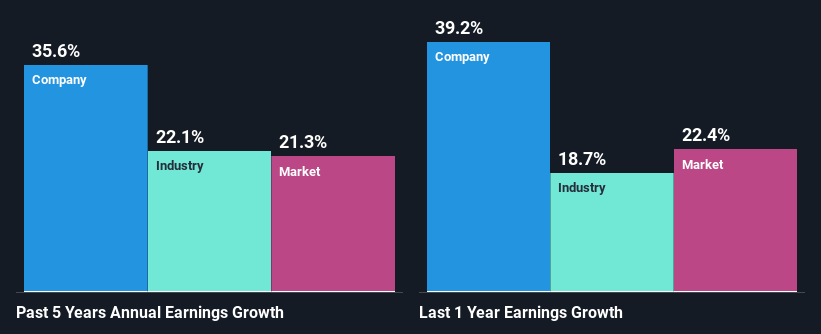
To begin with, Sigma Solve has a pretty high ROE which is interesting. Second, a comparison with the average ROE reported by the industry of 15% also doesn't go unnoticed by us. As a result, Sigma Solve's exceptional 36% net income growth seen over the past five years, doesn't come as a surprise.
As a next step, we compared Sigma Solve's net income growth with the industry, and pleasingly, we found that the growth seen by the company is higher than the average industry growth of 22%.
The basis for attaching value to a company is, to a great extent, tied to its earnings growth. The investor should try to establish if the expected growth or decline in earnings, whichever the case may be, is priced in. Doing so will help them establish if the stock's future looks promising or ominous. If you're wondering about Sigma Solve's's valuation, check out this gauge of its price-to-earnings ratio, as compared to its industry.
Is Sigma Solve Using Its Retained Earnings Effectively?
Sigma Solve's ' three-year median payout ratio is on the lower side at 2.4% implying that it is retaining a higher percentage (98%) of its profits. So it looks like Sigma Solve is reinvesting profits heavily to grow its business, which shows in its earnings growth.
Additionally, Sigma Solve has paid dividends over a period of three years which means that the company is pretty serious about sharing its profits with shareholders.
Conclusion
Overall, we are quite pleased with Sigma Solve's performance. In particular, it's great to see that the company is investing heavily into its business and along with a high rate of return, that has resulted in a sizeable growth in its earnings. If the company continues to grow its earnings the way it has, that could have a positive impact on its share price given how earnings per share influence long-term share prices. Let's not forget, business risk is also one of the factors that affects the price of the stock. So this is also an important area that investors need to pay attention to before making a decision on any business. To know the 2 risks we have identified for Sigma Solve visit our risks dashboard for free.
Mobile Infrastructure for Defense and Disaster
The next wave in robotics isn't humanoid. Its fully autonomous towers delivering 5G, ISR, and radar in under 30 minutes, anywhere.
Get the investor briefing before the next round of contracts
Sponsored On Behalf of CiTechNew: Manage All Your Stock Portfolios in One Place
We've created the ultimate portfolio companion for stock investors, and it's free.
• Connect an unlimited number of Portfolios and see your total in one currency
• Be alerted to new Warning Signs or Risks via email or mobile
• Track the Fair Value of your stocks
Have feedback on this article? Concerned about the content? Get in touch with us directly. Alternatively, email editorial-team (at) simplywallst.com.
This article by Simply Wall St is general in nature. We provide commentary based on historical data and analyst forecasts only using an unbiased methodology and our articles are not intended to be financial advice. It does not constitute a recommendation to buy or sell any stock, and does not take account of your objectives, or your financial situation. We aim to bring you long-term focused analysis driven by fundamental data. Note that our analysis may not factor in the latest price-sensitive company announcements or qualitative material. Simply Wall St has no position in any stocks mentioned.
About NSEI:SIGMA
Sigma Solve
Together with its subsidiary, Sigma Solve INC, engages in the enterprise software development business worldwide.
Flawless balance sheet with proven track record.
Similar Companies
Market Insights

Weekly Picks

Early mover in a fast growing industry. Likely to experience share price volatility as they scale


A case for CA$31.80 (undiluted), aka 8,616% upside from CA$0.37 (an 86 bagger!).


Moderation and Stabilisation: HOLD: Fair Price based on a 4-year Cycle is $12.08
Recently Updated Narratives


Title: Market Sentiment Is Dead Wrong — Here's Why PSEC Deserves a Second Look


An amazing opportunity to potentially get a 100 bagger

Amazon: Why the World’s Biggest Platform Still Runs on Invisible Economics
Popular Narratives


MicroVision will explode future revenue by 380.37% with a vision towards success


Crazy Undervalued 42 Baggers Silver Play (Active & Running Mine)


NVDA: Expanding AI Demand Will Drive Major Data Center Investments Through 2026
Trending Discussion
