
Advertisement
Sasken Technologies Limited's (NSE:SASKEN) Financials Are Too Obscure To Link With Current Share Price Momentum: What's In Store For the Stock?
Sasken Technologies' (NSE:SASKEN) stock is up by a considerable 14% over the past week. However, we decided to pay attention to the company's fundamentals which don't appear to give a clear sign about the company's financial health. Particularly, we will be paying attention to Sasken Technologies' ROE today.
Return on equity or ROE is a key measure used to assess how efficiently a company's management is utilizing the company's capital. In other words, it is a profitability ratio which measures the rate of return on the capital provided by the company's shareholders.
Check out our latest analysis for Sasken Technologies
How Is ROE Calculated?
The formula for ROE is:
Return on Equity = Net Profit (from continuing operations) ÷ Shareholders' Equity
So, based on the above formula, the ROE for Sasken Technologies is:
9.0% = ₹707m ÷ ₹7.8b (Based on the trailing twelve months to June 2024).
The 'return' is the yearly profit. So, this means that for every ₹1 of its shareholder's investments, the company generates a profit of ₹0.09.
What Has ROE Got To Do With Earnings Growth?
We have already established that ROE serves as an efficient profit-generating gauge for a company's future earnings. Depending on how much of these profits the company reinvests or "retains", and how effectively it does so, we are then able to assess a company’s earnings growth potential. Assuming all else is equal, companies that have both a higher return on equity and higher profit retention are usually the ones that have a higher growth rate when compared to companies that don't have the same features.
A Side By Side comparison of Sasken Technologies' Earnings Growth And 9.0% ROE
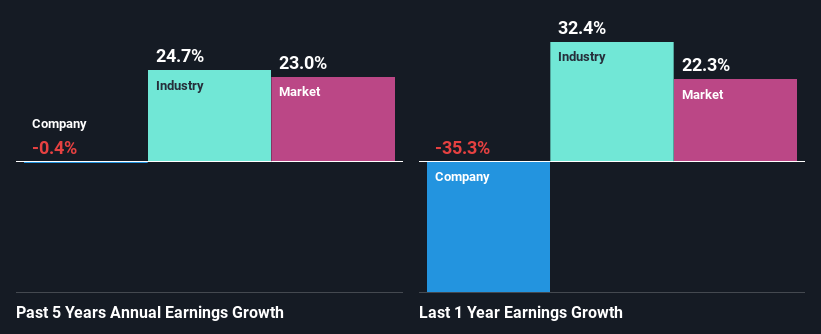
When you first look at it, Sasken Technologies' ROE doesn't look that attractive. A quick further study shows that the company's ROE doesn't compare favorably to the industry average of 13% either. Hence, the flat earnings seen by Sasken Technologies over the past five years could probably be the result of it having a lower ROE.
Next, on comparing with the industry net income growth, we found that the industry grew its earnings by 25% over the last few years.
Earnings growth is a huge factor in stock valuation. It’s important for an investor to know whether the market has priced in the company's expected earnings growth (or decline). This then helps them determine if the stock is placed for a bright or bleak future. One good indicator of expected earnings growth is the P/E ratio which determines the price the market is willing to pay for a stock based on its earnings prospects. So, you may want to check if Sasken Technologies is trading on a high P/E or a low P/E, relative to its industry.
Is Sasken Technologies Making Efficient Use Of Its Profits?
Despite having a normal three-year median payout ratio of 35% (implying that the company keeps 65% of its income) over the last three years, Sasken Technologies has seen a negligible amount of growth in earnings as we saw above. Therefore, there might be some other reasons to explain the lack in that respect. For example, the business could be in decline.
Additionally, Sasken Technologies has paid dividends over a period of at least ten years, which means that the company's management is determined to pay dividends even if it means little to no earnings growth.
Summary
In total, we're a bit ambivalent about Sasken Technologies' performance. Even though it appears to be retaining most of its profits, given the low ROE, investors may not be benefitting from all that reinvestment after all. The low earnings growth suggests our theory correct. So far, we've only made a quick discussion around the company's earnings growth. To gain further insights into Sasken Technologies' past profit growth, check out this visualization of past earnings, revenue and cash flows.
New: Manage All Your Stock Portfolios in One Place
We've created the ultimate portfolio companion for stock investors, and it's free.
• Connect an unlimited number of Portfolios and see your total in one currency
• Be alerted to new Warning Signs or Risks via email or mobile
• Track the Fair Value of your stocks
Have feedback on this article? Concerned about the content? Get in touch with us directly. Alternatively, email editorial-team (at) simplywallst.com.
This article by Simply Wall St is general in nature. We provide commentary based on historical data and analyst forecasts only using an unbiased methodology and our articles are not intended to be financial advice. It does not constitute a recommendation to buy or sell any stock, and does not take account of your objectives, or your financial situation. We aim to bring you long-term focused analysis driven by fundamental data. Note that our analysis may not factor in the latest price-sensitive company announcements or qualitative material. Simply Wall St has no position in any stocks mentioned.
About NSEI:SASKEN
Sasken Technologies
Provides product engineering and digital transformation services in India, North America, Europe, and internationally.
Flawless balance sheet with slight risk.
Similar Companies
Market Insights

Advertisement
Community Narratives
MINISO's fair value is projected at 26.69 with an anticipated PE ratio shift of 20x
Fair Value US$24.03|11.0% undervalued
BE
Community Contributor
Procter & Gamble: A Dividend Giant Facing Slowing Growth
Fair Value US$119.81|23.3% overvalued
AN
Community Contributor
Eli Lilly's Future Growth Driven by Tirzepatide and Favorable Market Conditions
Fair Value US$1.19k|13.8% undervalued
EA
Community Contributor