
Advertisement
Market Cool On AION-TECH Solutions Limited's (NSE:GOLDTECH) Revenues Pushing Shares 25% Lower
AION-TECH Solutions Limited (NSE:GOLDTECH) shareholders won't be pleased to see that the share price has had a very rough month, dropping 25% and undoing the prior period's positive performance. Of course, over the longer-term many would still wish they owned shares as the stock's price has soared 127% in the last twelve months.
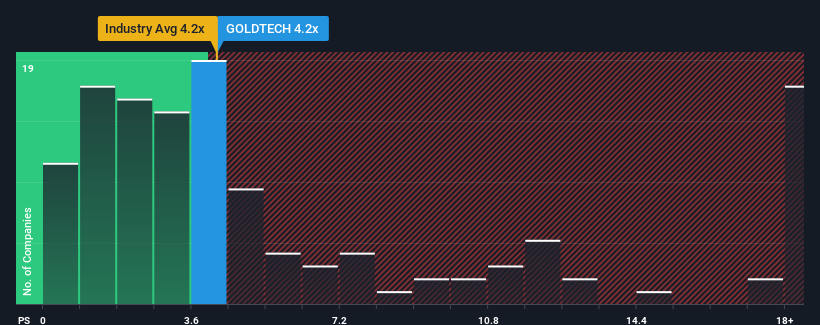
Even after such a large drop in price, it's still not a stretch to say that AION-TECH Solutions' price-to-sales (or "P/S") ratio of 4.2x right now seems quite "middle-of-the-road" compared to the IT industry in India, seeing as it matches the P/S ratio of the wider industry. Although, it's not wise to simply ignore the P/S without explanation as investors may be disregarding a distinct opportunity or a costly mistake.
See our latest analysis for AION-TECH Solutions
How AION-TECH Solutions Has Been Performing
AION-TECH Solutions has been doing a good job lately as it's been growing revenue at a solid pace. Perhaps the market is expecting future revenue performance to only keep up with the broader industry, which has keeping the P/S in line with expectations. If that doesn't eventuate, then existing shareholders probably aren't too pessimistic about the future direction of the share price.
Although there are no analyst estimates available for AION-TECH Solutions, take a look at this free data-rich visualisation to see how the company stacks up on earnings, revenue and cash flow.What Are Revenue Growth Metrics Telling Us About The P/S?
AION-TECH Solutions' P/S ratio would be typical for a company that's only expected to deliver moderate growth, and importantly, perform in line with the industry.
Taking a look back first, we see that the company grew revenue by an impressive 16% last year. Pleasingly, revenue has also lifted 95% in aggregate from three years ago, thanks to the last 12 months of growth. So we can start by confirming that the company has done a great job of growing revenue over that time.
This is in contrast to the rest of the industry, which is expected to grow by 7.9% over the next year, materially lower than the company's recent medium-term annualised growth rates.
With this information, we find it interesting that AION-TECH Solutions is trading at a fairly similar P/S compared to the industry. Apparently some shareholders believe the recent performance is at its limits and have been accepting lower selling prices.
The Key Takeaway
AION-TECH Solutions' plummeting stock price has brought its P/S back to a similar region as the rest of the industry. We'd say the price-to-sales ratio's power isn't primarily as a valuation instrument but rather to gauge current investor sentiment and future expectations.
To our surprise, AION-TECH Solutions revealed its three-year revenue trends aren't contributing to its P/S as much as we would have predicted, given they look better than current industry expectations. There could be some unobserved threats to revenue preventing the P/S ratio from matching this positive performance. While recent revenue trends over the past medium-term suggest that the risk of a price decline is low, investors appear to see the likelihood of revenue fluctuations in the future.
Before you take the next step, you should know about the 1 warning sign for AION-TECH Solutions that we have uncovered.
If you're unsure about the strength of AION-TECH Solutions' business, why not explore our interactive list of stocks with solid business fundamentals for some other companies you may have missed.
New: Manage All Your Stock Portfolios in One Place
We've created the ultimate portfolio companion for stock investors, and it's free.
• Connect an unlimited number of Portfolios and see your total in one currency
• Be alerted to new Warning Signs or Risks via email or mobile
• Track the Fair Value of your stocks
Have feedback on this article? Concerned about the content? Get in touch with us directly. Alternatively, email editorial-team (at) simplywallst.com.
This article by Simply Wall St is general in nature. We provide commentary based on historical data and analyst forecasts only using an unbiased methodology and our articles are not intended to be financial advice. It does not constitute a recommendation to buy or sell any stock, and does not take account of your objectives, or your financial situation. We aim to bring you long-term focused analysis driven by fundamental data. Note that our analysis may not factor in the latest price-sensitive company announcements or qualitative material. Simply Wall St has no position in any stocks mentioned.
About NSEI:GOLDTECH
AION-TECH Solutions
Provides business intelligence (BI), data analytics, and information technology (IT) consulting services in India and internationally.
Mediocre balance sheet with low risk.
Market Insights

Advertisement
Community Narratives
MINISO's fair value is projected at 26.69 with an anticipated PE ratio shift of 20x
Fair Value US$24.03|11.4% undervalued
BE
Community Contributor
Procter & Gamble: A Dividend Giant Facing Slowing Growth
Fair Value US$119.81|23.5% overvalued
AN
Community Contributor
Eli Lilly's Future Growth Driven by Tirzepatide and Favorable Market Conditions
Fair Value US$1.19k|14.0% undervalued
EA
Community Contributor