
Advertisement
- India
- /
- Retail Distributors
- /
- NSEI:SHANTHALA
Slammed 26% Shanthala FMCG Products Limited (NSE:SHANTHALA) Screens Well Here But There Might Be A Catch
The Shanthala FMCG Products Limited (NSE:SHANTHALA) share price has softened a substantial 26% over the previous 30 days, handing back much of the gains the stock has made lately. The drop over the last 30 days has capped off a tough year for shareholders, with the share price down 40% in that time.
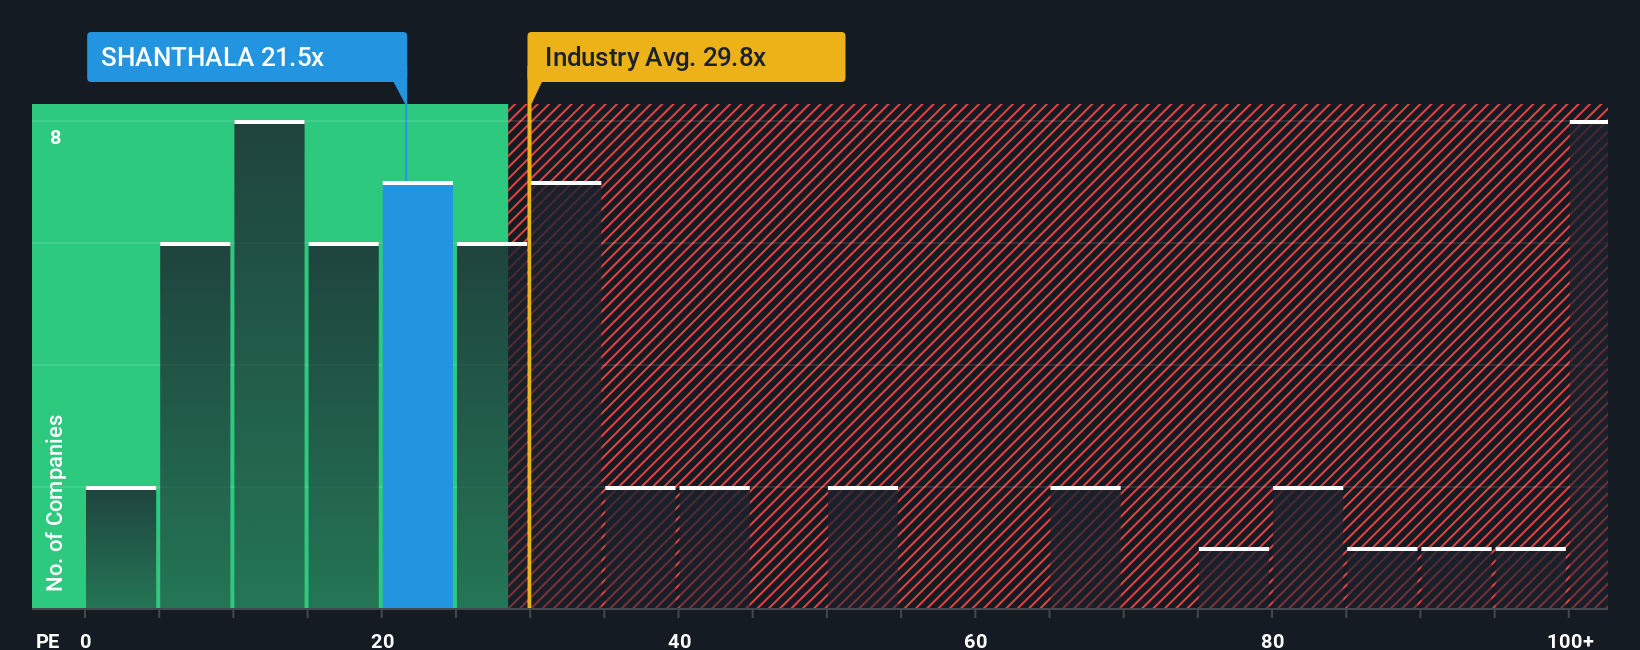
After such a large drop in price, Shanthala FMCG Products may be sending bullish signals at the moment with its price-to-earnings (or "P/E") ratio of 21.5x, since almost half of all companies in India have P/E ratios greater than 28x and even P/E's higher than 54x are not unusual. However, the P/E might be low for a reason and it requires further investigation to determine if it's justified.
Recent times have been quite advantageous for Shanthala FMCG Products as its earnings have been rising very briskly. One possibility is that the P/E is low because investors think this strong earnings growth might actually underperform the broader market in the near future. If that doesn't eventuate, then existing shareholders have reason to be quite optimistic about the future direction of the share price.
See our latest analysis for Shanthala FMCG Products
What Are Growth Metrics Telling Us About The Low P/E?
The only time you'd be truly comfortable seeing a P/E as low as Shanthala FMCG Products' is when the company's growth is on track to lag the market.
Retrospectively, the last year delivered an exceptional 114% gain to the company's bottom line. Pleasingly, EPS has also lifted 1,175% in aggregate from three years ago, thanks to the last 12 months of growth. Therefore, it's fair to say the earnings growth recently has been superb for the company.
Comparing that to the market, which is only predicted to deliver 25% growth in the next 12 months, the company's momentum is stronger based on recent medium-term annualised earnings results.
In light of this, it's peculiar that Shanthala FMCG Products' P/E sits below the majority of other companies. It looks like most investors are not convinced the company can maintain its recent growth rates.
The Final Word
Shanthala FMCG Products' P/E has taken a tumble along with its share price. Generally, our preference is to limit the use of the price-to-earnings ratio to establishing what the market thinks about the overall health of a company.
We've established that Shanthala FMCG Products currently trades on a much lower than expected P/E since its recent three-year growth is higher than the wider market forecast. There could be some major unobserved threats to earnings preventing the P/E ratio from matching this positive performance. It appears many are indeed anticipating earnings instability, because the persistence of these recent medium-term conditions would normally provide a boost to the share price.
There are also other vital risk factors to consider before investing and we've discovered 2 warning signs for Shanthala FMCG Products that you should be aware of.
If these risks are making you reconsider your opinion on Shanthala FMCG Products, explore our interactive list of high quality stocks to get an idea of what else is out there.
New: Manage All Your Stock Portfolios in One Place
We've created the ultimate portfolio companion for stock investors, and it's free.
• Connect an unlimited number of Portfolios and see your total in one currency
• Be alerted to new Warning Signs or Risks via email or mobile
• Track the Fair Value of your stocks
Have feedback on this article? Concerned about the content? Get in touch with us directly. Alternatively, email editorial-team (at) simplywallst.com.
This article by Simply Wall St is general in nature. We provide commentary based on historical data and analyst forecasts only using an unbiased methodology and our articles are not intended to be financial advice. It does not constitute a recommendation to buy or sell any stock, and does not take account of your objectives, or your financial situation. We aim to bring you long-term focused analysis driven by fundamental data. Note that our analysis may not factor in the latest price-sensitive company announcements or qualitative material. Simply Wall St has no position in any stocks mentioned.
About NSEI:SHANTHALA
Solid track record with adequate balance sheet.
Market Insights

Advertisement
Community Narratives
The company that turned a verb into a global necessity and basically runs the modern internet, digital ads, smartphones, maps, and AI.
Fair Value US$300.00|10.8% undervalued
OS
Community Contributor
Flowers Foods Pays A Fair Price For Health
Fair Value US$16.12|22.0% undervalued
NV
Community Contributor
TMX Group will thrive with 33.3% profit margin and enduring market moat
Fair Value CA$49.90|3.8% overvalued
LI
Community Contributor