
Advertisement
- India
- /
- Real Estate
- /
- NSEI:SHRADHA
Even With A 27% Surge, Cautious Investors Are Not Rewarding Shradha Infraprojects Limited's (NSE:SHRADHA) Performance Completely
The Shradha Infraprojects Limited (NSE:SHRADHA) share price has done very well over the last month, posting an excellent gain of 27%. The last month tops off a massive increase of 112% in the last year.
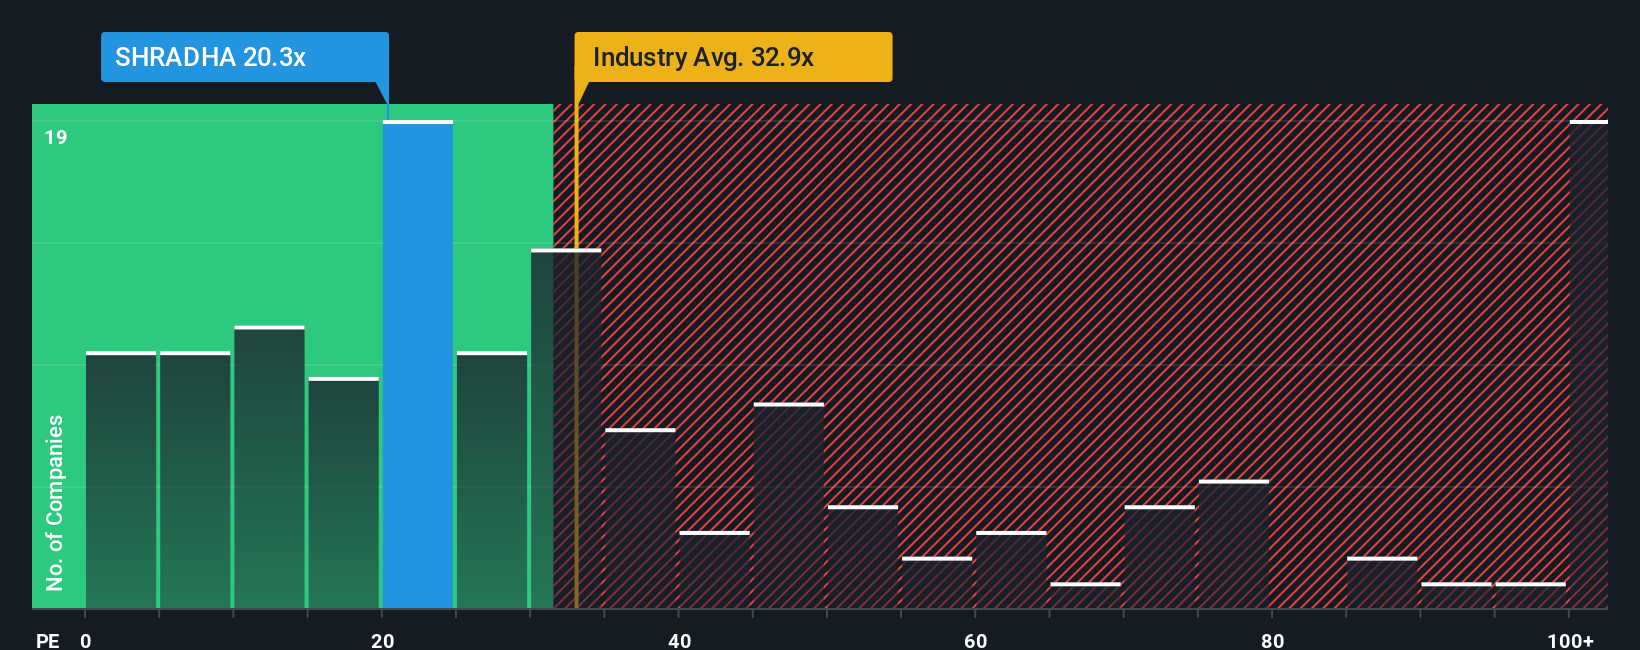
In spite of the firm bounce in price, Shradha Infraprojects may still be sending bullish signals at the moment with its price-to-earnings (or "P/E") ratio of 20.3x, since almost half of all companies in India have P/E ratios greater than 30x and even P/E's higher than 57x are not unusual. Nonetheless, we'd need to dig a little deeper to determine if there is a rational basis for the reduced P/E.
As an illustration, earnings have deteriorated at Shradha Infraprojects over the last year, which is not ideal at all. One possibility is that the P/E is low because investors think the company won't do enough to avoid underperforming the broader market in the near future. If you like the company, you'd be hoping this isn't the case so that you could potentially pick up some stock while it's out of favour.
Check out our latest analysis for Shradha Infraprojects
Is There Any Growth For Shradha Infraprojects?
There's an inherent assumption that a company should underperform the market for P/E ratios like Shradha Infraprojects' to be considered reasonable.
Retrospectively, the last year delivered a frustrating 1.2% decrease to the company's bottom line. Still, the latest three year period has seen an excellent 1,153% overall rise in EPS, in spite of its unsatisfying short-term performance. So we can start by confirming that the company has generally done a very good job of growing earnings over that time, even though it had some hiccups along the way.
Weighing that recent medium-term earnings trajectory against the broader market's one-year forecast for expansion of 23% shows it's noticeably more attractive on an annualised basis.
With this information, we find it odd that Shradha Infraprojects is trading at a P/E lower than the market. Apparently some shareholders believe the recent performance has exceeded its limits and have been accepting significantly lower selling prices.

What We Can Learn From Shradha Infraprojects' P/E?
Shradha Infraprojects' stock might have been given a solid boost, but its P/E certainly hasn't reached any great heights. While the price-to-earnings ratio shouldn't be the defining factor in whether you buy a stock or not, it's quite a capable barometer of earnings expectations.
Our examination of Shradha Infraprojects revealed its three-year earnings trends aren't contributing to its P/E anywhere near as much as we would have predicted, given they look better than current market expectations. When we see strong earnings with faster-than-market growth, we assume potential risks are what might be placing significant pressure on the P/E ratio. It appears many are indeed anticipating earnings instability, because the persistence of these recent medium-term conditions would normally provide a boost to the share price.
And what about other risks? Every company has them, and we've spotted 4 warning signs for Shradha Infraprojects (of which 1 can't be ignored!) you should know about.
You might be able to find a better investment than Shradha Infraprojects. If you want a selection of possible candidates, check out this free list of interesting companies that trade on a low P/E (but have proven they can grow earnings).
New: Manage All Your Stock Portfolios in One Place
We've created the ultimate portfolio companion for stock investors, and it's free.
• Connect an unlimited number of Portfolios and see your total in one currency
• Be alerted to new Warning Signs or Risks via email or mobile
• Track the Fair Value of your stocks
Have feedback on this article? Concerned about the content? Get in touch with us directly. Alternatively, email editorial-team (at) simplywallst.com.
This article by Simply Wall St is general in nature. We provide commentary based on historical data and analyst forecasts only using an unbiased methodology and our articles are not intended to be financial advice. It does not constitute a recommendation to buy or sell any stock, and does not take account of your objectives, or your financial situation. We aim to bring you long-term focused analysis driven by fundamental data. Note that our analysis may not factor in the latest price-sensitive company announcements or qualitative material. Simply Wall St has no position in any stocks mentioned.
About NSEI:SHRADHA
Shradha Infraprojects
An infrastructure development company, engages in the real estate development business in India.
Adequate balance sheet with slight risk.
Market Insights

Advertisement
Weekly Picks
RO


RockeTeller on Santacruz Silver Mining ·
Crazy Undervalued 42 Baggers Silver Play (Active & Running Mine)
Fair Value:CA$8696.7% undervalued
59 followersusers have followed this narrative
7 commentsusers have commented on this narrative
17 likesusers have liked this narrative
RO


Robbo on Fiducian Group ·
Fiducian: Compliance Clouds or Value Opportunity?
Fair Value:AU$122.0% undervalued
9 followersusers have followed this narrative
0 commentsusers have commented on this narrative
0 likesusers have liked this narrative
WO

woodworthfund on Willamette Valley Vineyards ·
Willamette Valley Vineyards (WVVI): Not-So-Great Value
Fair Value:US$242.5% overvalued
10 followersusers have followed this narrative
0 commentsusers have commented on this narrative
1 likeusers have liked this narrative
Recently Updated Narratives
WO

woodworthfund on MGP Ingredients ·
THE KINGDOM OF BROWN GOODS: WHY MGPI IS BEING CRUSHED BY INVENTORY & PRIMED FOR RESURRECTION
Fair Value:US$4035.8% undervalued
2 followersusers have followed this narrative
0 commentsusers have commented on this narrative
0 likesusers have liked this narrative
DA


davidlsander on Beam Therapeutics ·
The "Molecular Pencil": Why Beam's Technology is Built to Win
Fair Value:US$15081.9% undervalued
50 followersusers have followed this narrative
3 commentsusers have commented on this narrative
1 likeusers have liked this narrative
MO


mo7md on ADNOC Gas ·
ADNOC Gas future shines with a 21.4% revenue surge
Fair Value:د.إ3.728.9% undervalued
3 followersusers have followed this narrative
0 commentsusers have commented on this narrative
0 likesusers have liked this narrative
Popular Narratives
TH


TheWallstreetKing on MicroVision ·
MicroVision will explode future revenue by 380.37% with a vision towards success
Fair Value:US$6098.5% undervalued
117 followersusers have followed this narrative
11 commentsusers have commented on this narrative
22 likesusers have liked this narrative
AN


AnalystConsensusTarget on NVIDIA ·
NVDA: Expanding AI Demand Will Drive Major Data Center Investments Through 2026
Fair Value:US$250.3927.2% undervalued
959 followersusers have followed this narrative
6 commentsusers have commented on this narrative
25 likesusers have liked this narrative
RO
RockeTeller on Santacruz Silver Mining ·
Crazy Undervalued 42 Baggers Silver Play (Active & Running Mine)
Fair Value:CA$8696.7% undervalued
59 followersusers have followed this narrative
7 commentsusers have commented on this narrative
17 likesusers have liked this narrative

