
Advertisement
- India
- /
- Real Estate
- /
- NSEI:ARTNIRMAN
These 4 Measures Indicate That Art Nirman (NSE:ARTNIRMAN) Is Using Debt Extensively
Warren Buffett famously said, 'Volatility is far from synonymous with risk.' So it might be obvious that you need to consider debt, when you think about how risky any given stock is, because too much debt can sink a company. As with many other companies Art Nirman Limited (NSE:ARTNIRMAN) makes use of debt. But the real question is whether this debt is making the company risky.
What Risk Does Debt Bring?
Debt assists a business until the business has trouble paying it off, either with new capital or with free cash flow. If things get really bad, the lenders can take control of the business. However, a more usual (but still expensive) situation is where a company must dilute shareholders at a cheap share price simply to get debt under control. Of course, plenty of companies use debt to fund growth, without any negative consequences. When we examine debt levels, we first consider both cash and debt levels, together.
What Is Art Nirman's Debt?
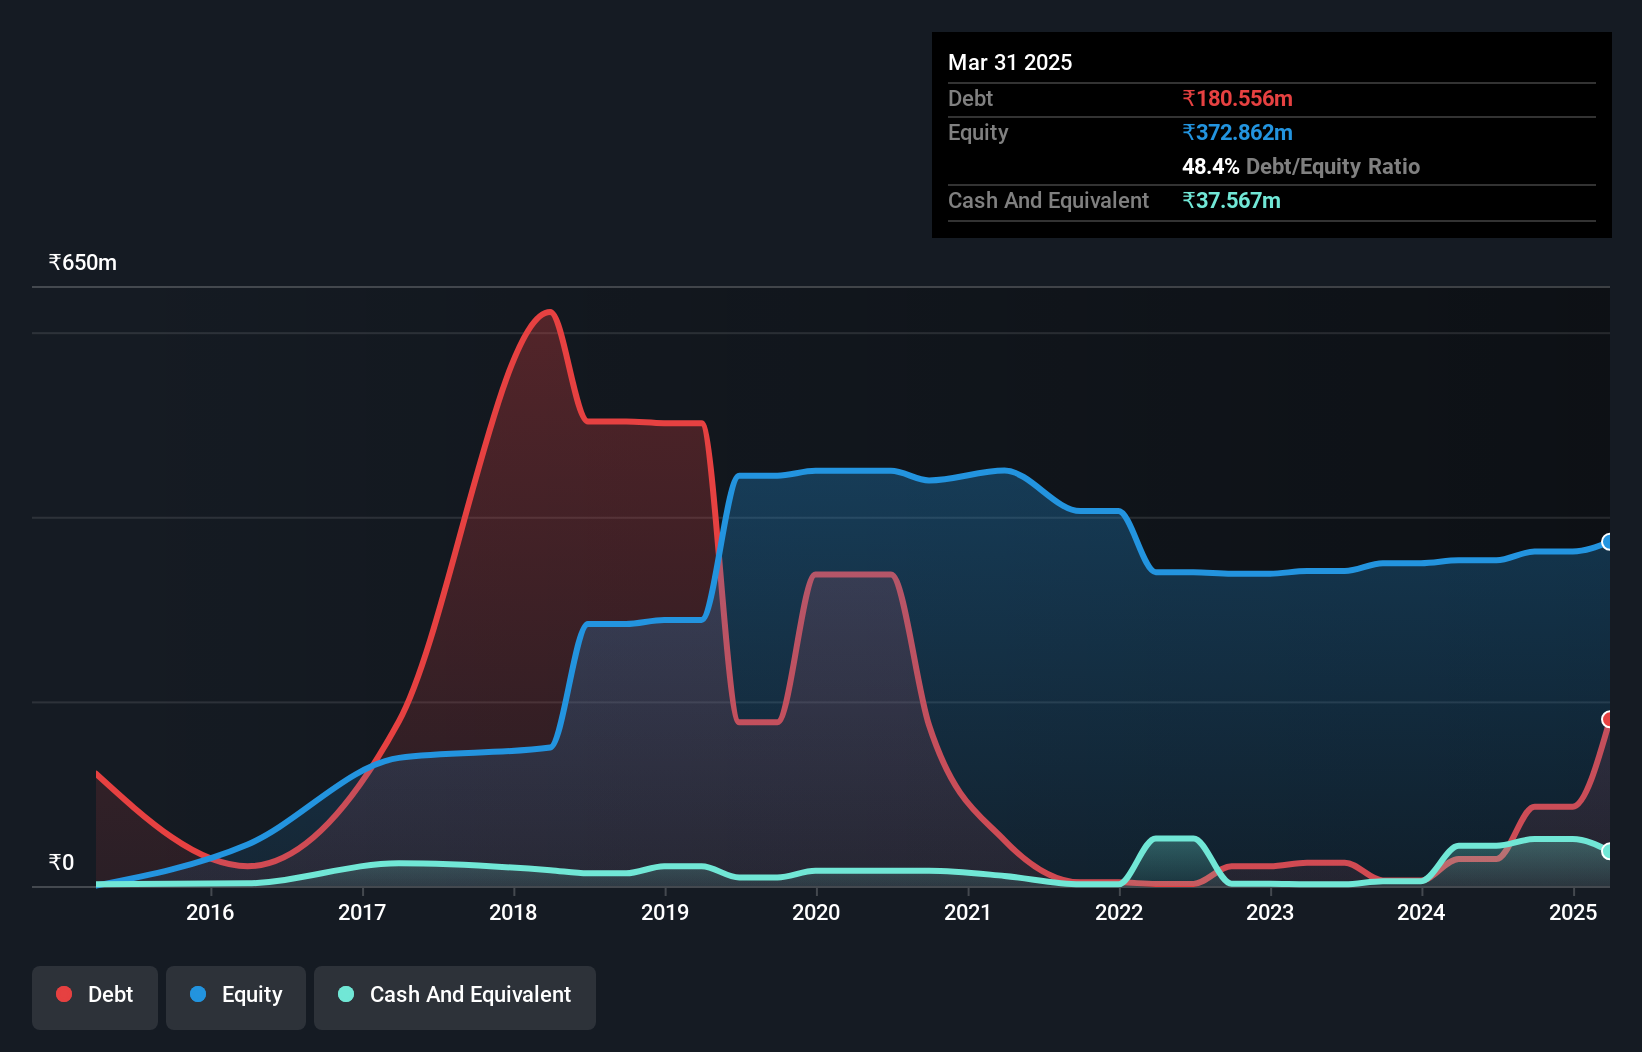
You can click the graphic below for the historical numbers, but it shows that as of March 2025 Art Nirman had ₹180.6m of debt, an increase on ₹29.2m, over one year. On the flip side, it has ₹37.6m in cash leading to net debt of about ₹143.0m.
How Healthy Is Art Nirman's Balance Sheet?
We can see from the most recent balance sheet that Art Nirman had liabilities of ₹114.3m falling due within a year, and liabilities of ₹201.0m due beyond that. Offsetting this, it had ₹37.6m in cash and ₹74.9m in receivables that were due within 12 months. So its liabilities total ₹202.8m more than the combination of its cash and short-term receivables.
Given Art Nirman has a market capitalization of ₹1.23b, it's hard to believe these liabilities pose much threat. Having said that, it's clear that we should continue to monitor its balance sheet, lest it change for the worse.
Check out our latest analysis for Art Nirman
We use two main ratios to inform us about debt levels relative to earnings. The first is net debt divided by earnings before interest, tax, depreciation, and amortization (EBITDA), while the second is how many times its earnings before interest and tax (EBIT) covers its interest expense (or its interest cover, for short). Thus we consider debt relative to earnings both with and without depreciation and amortization expenses.
While we wouldn't worry about Art Nirman's net debt to EBITDA ratio of 4.4, we think its super-low interest cover of 2.4 times is a sign of high leverage. So shareholders should probably be aware that interest expenses appear to have really impacted the business lately. Looking on the bright side, Art Nirman boosted its EBIT by a silky 83% in the last year. Like a mother's loving embrace of a newborn that sort of growth builds resilience, putting the company in a stronger position to manage its debt. There's no doubt that we learn most about debt from the balance sheet. But it is Art Nirman's earnings that will influence how the balance sheet holds up in the future. So if you're keen to discover more about its earnings, it might be worth checking out this graph of its long term earnings trend.
But our final consideration is also important, because a company cannot pay debt with paper profits; it needs cold hard cash. So the logical step is to look at the proportion of that EBIT that is matched by actual free cash flow. Over the last three years, Art Nirman saw substantial negative free cash flow, in total. While investors are no doubt expecting a reversal of that situation in due course, it clearly does mean its use of debt is more risky.
Our View
Art Nirman's conversion of EBIT to free cash flow and interest cover definitely weigh on it, in our esteem. But the good news is it seems to be able to grow its EBIT with ease. We think that Art Nirman's debt does make it a bit risky, after considering the aforementioned data points together. That's not necessarily a bad thing, since leverage can boost returns on equity, but it is something to be aware of. The balance sheet is clearly the area to focus on when you are analysing debt. But ultimately, every company can contain risks that exist outside of the balance sheet. For example, we've discovered 4 warning signs for Art Nirman (2 shouldn't be ignored!) that you should be aware of before investing here.
If you're interested in investing in businesses that can grow profits without the burden of debt, then check out this free list of growing businesses that have net cash on the balance sheet.
New: Manage All Your Stock Portfolios in One Place
We've created the ultimate portfolio companion for stock investors, and it's free.
• Connect an unlimited number of Portfolios and see your total in one currency
• Be alerted to new Warning Signs or Risks via email or mobile
• Track the Fair Value of your stocks
Have feedback on this article? Concerned about the content? Get in touch with us directly. Alternatively, email editorial-team (at) simplywallst.com.
This article by Simply Wall St is general in nature. We provide commentary based on historical data and analyst forecasts only using an unbiased methodology and our articles are not intended to be financial advice. It does not constitute a recommendation to buy or sell any stock, and does not take account of your objectives, or your financial situation. We aim to bring you long-term focused analysis driven by fundamental data. Note that our analysis may not factor in the latest price-sensitive company announcements or qualitative material. Simply Wall St has no position in any stocks mentioned.
About NSEI:ARTNIRMAN
Art Nirman
Engages in the real estate development and allied activities in India.
Excellent balance sheet with acceptable track record.
Similar Companies
Market Insights

Advertisement
Community Narratives
Finding The True Value Of A Logistics Powerhouse
Fair Value US$95.21|8.6% undervalued
NV
Community Contributor
Paradigm Biopharmaceuticals Will Lead Osteoarthritis Treatment with Zilosul's FDA Success
Fair Value AU$5.50|92.1% undervalued
AM
Community Contributor
Barrick Mining (ABX:CA): A Gold Hedge against a U.S. Shutdown
Fair Value CA$60.00|25.6% undervalued
GM
Community Contributor