
Advertisement
Estimating The Intrinsic Value Of Biocon Limited (NSE:BIOCON)
Key Insights
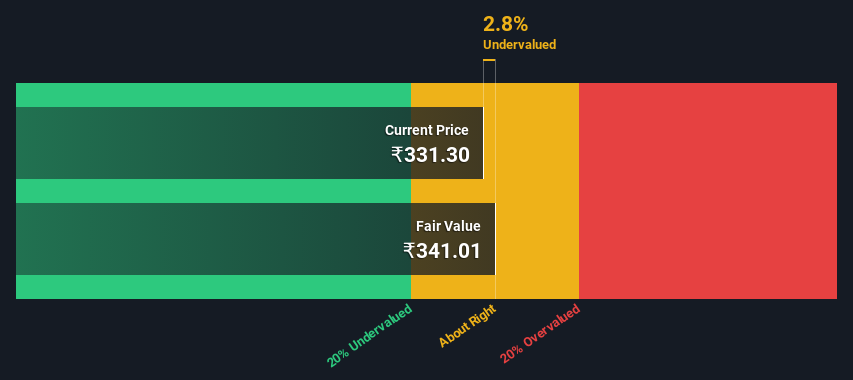
- The projected fair value for Biocon is ₹341 based on 2 Stage Free Cash Flow to Equity
- Current share price of ₹331 suggests Biocon is potentially trading close to its fair value
- Analyst price target for BIOCON is ₹381, which is 12% above our fair value estimate
Today we'll do a simple run through of a valuation method used to estimate the attractiveness of Biocon Limited (NSE:BIOCON) as an investment opportunity by taking the expected future cash flows and discounting them to today's value. We will use the Discounted Cash Flow (DCF) model on this occasion. Don't get put off by the jargon, the math behind it is actually quite straightforward.
Remember though, that there are many ways to estimate a company's value, and a DCF is just one method. If you want to learn more about discounted cash flow, the rationale behind this calculation can be read in detail in the Simply Wall St analysis model.
The Method
We use what is known as a 2-stage model, which simply means we have two different periods of growth rates for the company's cash flows. Generally the first stage is higher growth, and the second stage is a lower growth phase. To begin with, we have to get estimates of the next ten years of cash flows. Where possible we use analyst estimates, but when these aren't available we extrapolate the previous free cash flow (FCF) from the last estimate or reported value. We assume companies with shrinking free cash flow will slow their rate of shrinkage, and that companies with growing free cash flow will see their growth rate slow, over this period. We do this to reflect that growth tends to slow more in the early years than it does in later years.
A DCF is all about the idea that a dollar in the future is less valuable than a dollar today, and so the sum of these future cash flows is then discounted to today's value:
10-year free cash flow (FCF) forecast
| 2025 | 2026 | 2027 | 2028 | 2029 | 2030 | 2031 | 2032 | 2033 | 2034 | |
| Levered FCF (₹, Millions) | ₹16.1b | ₹21.6b | ₹27.3b | ₹32.0b | ₹36.4b | ₹40.7b | ₹44.8b | ₹49.0b | ₹53.1b | ₹57.3b |
| Growth Rate Estimate Source | Analyst x4 | Analyst x4 | Analyst x4 | Est @ 17.00% | Est @ 13.92% | Est @ 11.76% | Est @ 10.25% | Est @ 9.19% | Est @ 8.45% | Est @ 7.93% |
| Present Value (₹, Millions) Discounted @ 14% | ₹14.1k | ₹16.7k | ₹18.5k | ₹19.0k | ₹19.0k | ₹18.7k | ₹18.1k | ₹17.3k | ₹16.5k | ₹15.7k |
("Est" = FCF growth rate estimated by Simply Wall St)
Present Value of 10-year Cash Flow (PVCF) = ₹174b
We now need to calculate the Terminal Value, which accounts for all the future cash flows after this ten year period. The Gordon Growth formula is used to calculate Terminal Value at a future annual growth rate equal to the 5-year average of the 10-year government bond yield of 6.7%. We discount the terminal cash flows to today's value at a cost of equity of 14%.
Terminal Value (TV)= FCF2034 × (1 + g) ÷ (r – g) = ₹57b× (1 + 6.7%) ÷ (14%– 6.7%) = ₹858b
Present Value of Terminal Value (PVTV)= TV / (1 + r)10= ₹858b÷ ( 1 + 14%)10= ₹234b
The total value is the sum of cash flows for the next ten years plus the discounted terminal value, which results in the Total Equity Value, which in this case is ₹408b. The last step is to then divide the equity value by the number of shares outstanding. Relative to the current share price of ₹331, the company appears about fair value at a 2.8% discount to where the stock price trades currently. Remember though, that this is just an approximate valuation, and like any complex formula - garbage in, garbage out.
Important Assumptions
Now the most important inputs to a discounted cash flow are the discount rate, and of course, the actual cash flows. Part of investing is coming up with your own evaluation of a company's future performance, so try the calculation yourself and check your own assumptions. The DCF also does not consider the possible cyclicality of an industry, or a company's future capital requirements, so it does not give a full picture of a company's potential performance. Given that we are looking at Biocon as potential shareholders, the cost of equity is used as the discount rate, rather than the cost of capital (or weighted average cost of capital, WACC) which accounts for debt. In this calculation we've used 14%, which is based on a levered beta of 0.982. Beta is a measure of a stock's volatility, compared to the market as a whole. We get our beta from the industry average beta of globally comparable companies, with an imposed limit between 0.8 and 2.0, which is a reasonable range for a stable business.
See our latest analysis for Biocon
SWOT Analysis for Biocon
Strength
- Debt is well covered by cash flow.
- Dividends are covered by earnings and cash flows.
Weakness
- Earnings declined over the past year.
- Interest payments on debt are not well covered.
- Dividend is low compared to the top 25% of dividend payers in the Biotechs market.
Opportunity
- Annual earnings are forecast to grow faster than the Indian market.
- Current share price is below our estimate of fair value.
Threat
- Revenue is forecast to grow slower than 20% per year.
Next Steps:
Whilst important, the DCF calculation is only one of many factors that you need to assess for a company. The DCF model is not a perfect stock valuation tool. Instead the best use for a DCF model is to test certain assumptions and theories to see if they would lead to the company being undervalued or overvalued. For instance, if the terminal value growth rate is adjusted slightly, it can dramatically alter the overall result. For Biocon, there are three important elements you should explore:
- Risks: For instance, we've identified 3 warning signs for Biocon (1 shouldn't be ignored) you should be aware of.
- Future Earnings: How does BIOCON's growth rate compare to its peers and the wider market? Dig deeper into the analyst consensus number for the upcoming years by interacting with our free analyst growth expectation chart.
- Other Solid Businesses: Low debt, high returns on equity and good past performance are fundamental to a strong business. Why not explore our interactive list of stocks with solid business fundamentals to see if there are other companies you may not have considered!
PS. Simply Wall St updates its DCF calculation for every Indian stock every day, so if you want to find the intrinsic value of any other stock just search here.
Valuation is complex, but we're here to simplify it.
Discover if Biocon might be undervalued or overvalued with our detailed analysis, featuring fair value estimates, potential risks, dividends, insider trades, and its financial condition.
Access Free AnalysisHave feedback on this article? Concerned about the content? Get in touch with us directly. Alternatively, email editorial-team (at) simplywallst.com.
This article by Simply Wall St is general in nature. We provide commentary based on historical data and analyst forecasts only using an unbiased methodology and our articles are not intended to be financial advice. It does not constitute a recommendation to buy or sell any stock, and does not take account of your objectives, or your financial situation. We aim to bring you long-term focused analysis driven by fundamental data. Note that our analysis may not factor in the latest price-sensitive company announcements or qualitative material. Simply Wall St has no position in any stocks mentioned.
About NSEI:BIOCON
Biocon
Manufactures and sells biotechnology products and research services in India, the United States, Ireland, rest of the European Union, and internationally.
Reasonable growth potential with adequate balance sheet.
Similar Companies
Market Insights

Advertisement
Community Narratives
MINISO's fair value is projected at 26.69 with an anticipated PE ratio shift of 20x
Fair Value US$24.03|11.0% undervalued
BE
Community Contributor
Procter & Gamble: A Dividend Giant Facing Slowing Growth
Fair Value US$119.81|23.3% overvalued
AN
Community Contributor
Eli Lilly's Future Growth Driven by Tirzepatide and Favorable Market Conditions
Fair Value US$1.19k|13.8% undervalued
EA
Community Contributor