
Advertisement
- India
- /
- Metals and Mining
- /
- NSEI:SHYAMMETL
Is Shyam Metalics and Energy Limited (NSE:SHYAMMETL) Expensive For A Reason? A Look At Its Intrinsic Value
Key Insights
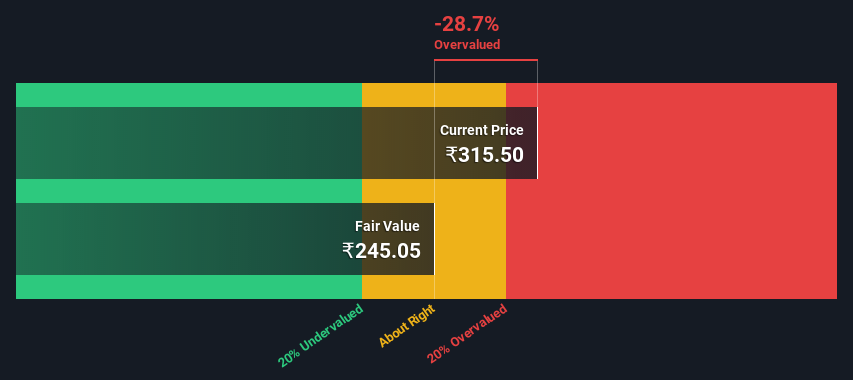
- Shyam Metalics and Energy's estimated fair value is ₹245 based on 2 Stage Free Cash Flow to Equity
- Shyam Metalics and Energy's ₹316 share price signals that it might be 29% overvalued
- The ₹493 analyst price target for SHYAMMETL is 101% more than our estimate of fair value
Does the June share price for Shyam Metalics and Energy Limited (NSE:SHYAMMETL) reflect what it's really worth? Today, we will estimate the stock's intrinsic value by taking the forecast future cash flows of the company and discounting them back to today's value. We will use the Discounted Cash Flow (DCF) model on this occasion. Believe it or not, it's not too difficult to follow, as you'll see from our example!
We would caution that there are many ways of valuing a company and, like the DCF, each technique has advantages and disadvantages in certain scenarios. If you still have some burning questions about this type of valuation, take a look at the Simply Wall St analysis model.
See our latest analysis for Shyam Metalics and Energy
Is Shyam Metalics and Energy Fairly Valued?
We are going to use a two-stage DCF model, which, as the name states, takes into account two stages of growth. The first stage is generally a higher growth period which levels off heading towards the terminal value, captured in the second 'steady growth' period. To start off with, we need to estimate the next ten years of cash flows. Where possible we use analyst estimates, but when these aren't available we extrapolate the previous free cash flow (FCF) from the last estimate or reported value. We assume companies with shrinking free cash flow will slow their rate of shrinkage, and that companies with growing free cash flow will see their growth rate slow, over this period. We do this to reflect that growth tends to slow more in the early years than it does in later years.
A DCF is all about the idea that a dollar in the future is less valuable than a dollar today, so we discount the value of these future cash flows to their estimated value in today's dollars:
10-year free cash flow (FCF) estimate
| 2023 | 2024 | 2025 | 2026 | 2027 | 2028 | 2029 | 2030 | 2031 | 2032 | |
| Levered FCF (₹, Millions) | -₹2.17b | ₹4.57b | ₹5.69b | ₹7.79b | ₹9.51b | ₹11.2b | ₹12.8b | ₹14.3b | ₹15.8b | ₹17.3b |
| Growth Rate Estimate Source | Analyst x2 | Analyst x1 | Analyst x2 | Analyst x1 | Est @ 22.09% | Est @ 17.50% | Est @ 14.29% | Est @ 12.04% | Est @ 10.47% | Est @ 9.37% |
| Present Value (₹, Millions) Discounted @ 18% | -₹1.8k | ₹3.3k | ₹3.5k | ₹4.0k | ₹4.1k | ₹4.1k | ₹4.0k | ₹3.8k | ₹3.5k | ₹3.3k |
("Est" = FCF growth rate estimated by Simply Wall St)
Present Value of 10-year Cash Flow (PVCF) = ₹32b
We now need to calculate the Terminal Value, which accounts for all the future cash flows after this ten year period. For a number of reasons a very conservative growth rate is used that cannot exceed that of a country's GDP growth. In this case we have used the 5-year average of the 10-year government bond yield (6.8%) to estimate future growth. In the same way as with the 10-year 'growth' period, we discount future cash flows to today's value, using a cost of equity of 18%.
Terminal Value (TV)= FCF2032 × (1 + g) ÷ (r – g) = ₹17b× (1 + 6.8%) ÷ (18%– 6.8%) = ₹163b
Present Value of Terminal Value (PVTV)= TV / (1 + r)10= ₹163b÷ ( 1 + 18%)10= ₹31b
The total value, or equity value, is then the sum of the present value of the future cash flows, which in this case is ₹63b. In the final step we divide the equity value by the number of shares outstanding. Relative to the current share price of ₹316, the company appears slightly overvalued at the time of writing. Valuations are imprecise instruments though, rather like a telescope - move a few degrees and end up in a different galaxy. Do keep this in mind.
Important Assumptions
The calculation above is very dependent on two assumptions. The first is the discount rate and the other is the cash flows. If you don't agree with these result, have a go at the calculation yourself and play with the assumptions. The DCF also does not consider the possible cyclicality of an industry, or a company's future capital requirements, so it does not give a full picture of a company's potential performance. Given that we are looking at Shyam Metalics and Energy as potential shareholders, the cost of equity is used as the discount rate, rather than the cost of capital (or weighted average cost of capital, WACC) which accounts for debt. In this calculation we've used 18%, which is based on a levered beta of 1.164. Beta is a measure of a stock's volatility, compared to the market as a whole. We get our beta from the industry average beta of globally comparable companies, with an imposed limit between 0.8 and 2.0, which is a reasonable range for a stable business.
SWOT Analysis for Shyam Metalics and Energy
Strength
- Debt is not viewed as a risk.
Weakness
- Earnings declined over the past year.
- Dividend is low compared to the top 25% of dividend payers in the Metals and Mining market.
Opportunity
- Annual earnings are forecast to grow faster than the Indian market.
- Good value based on P/E ratio compared to estimated Fair P/E ratio.
Threat
- Paying a dividend but company has no free cash flows.
- Revenue is forecast to grow slower than 20% per year.
Next Steps:
Whilst important, the DCF calculation is only one of many factors that you need to assess for a company. The DCF model is not a perfect stock valuation tool. Rather it should be seen as a guide to "what assumptions need to be true for this stock to be under/overvalued?" For instance, if the terminal value growth rate is adjusted slightly, it can dramatically alter the overall result. Can we work out why the company is trading at a premium to intrinsic value? For Shyam Metalics and Energy, we've put together three important items you should look at:
- Risks: We feel that you should assess the 2 warning signs for Shyam Metalics and Energy we've flagged before making an investment in the company.
- Future Earnings: How does SHYAMMETL's growth rate compare to its peers and the wider market? Dig deeper into the analyst consensus number for the upcoming years by interacting with our free analyst growth expectation chart.
- Other Solid Businesses: Low debt, high returns on equity and good past performance are fundamental to a strong business. Why not explore our interactive list of stocks with solid business fundamentals to see if there are other companies you may not have considered!
PS. Simply Wall St updates its DCF calculation for every Indian stock every day, so if you want to find the intrinsic value of any other stock just search here.
New: Manage All Your Stock Portfolios in One Place
We've created the ultimate portfolio companion for stock investors, and it's free.
• Connect an unlimited number of Portfolios and see your total in one currency
• Be alerted to new Warning Signs or Risks via email or mobile
• Track the Fair Value of your stocks
Have feedback on this article? Concerned about the content? Get in touch with us directly. Alternatively, email editorial-team (at) simplywallst.com.
This article by Simply Wall St is general in nature. We provide commentary based on historical data and analyst forecasts only using an unbiased methodology and our articles are not intended to be financial advice. It does not constitute a recommendation to buy or sell any stock, and does not take account of your objectives, or your financial situation. We aim to bring you long-term focused analysis driven by fundamental data. Note that our analysis may not factor in the latest price-sensitive company announcements or qualitative material. Simply Wall St has no position in any stocks mentioned.
About NSEI:SHYAMMETL
Shyam Metalics and Energy
An integrated metal-producing company, manufactures and sells long steel products and ferro alloys in India, and internationally.
Flawless balance sheet with high growth potential.
Similar Companies
Market Insights

Advertisement
Community Narratives
MINISO's fair value is projected at 26.69 with an anticipated PE ratio shift of 20x
Fair Value US$24.03|11.4% undervalued
BE
Community Contributor
Procter & Gamble: A Dividend Giant Facing Slowing Growth
Fair Value US$119.81|23.5% overvalued
AN
Community Contributor
Eli Lilly's Future Growth Driven by Tirzepatide and Favorable Market Conditions
Fair Value US$1.19k|14.0% undervalued
EA
Community Contributor