
Advertisement
- India
- /
- Paper and Forestry Products
- /
- NSEI:SHREYANIND
The Returns On Capital At Shreyans Industries (NSE:SHREYANIND) Don't Inspire Confidence
What trends should we look for it we want to identify stocks that can multiply in value over the long term? Firstly, we'd want to identify a growing return on capital employed (ROCE) and then alongside that, an ever-increasing base of capital employed. Put simply, these types of businesses are compounding machines, meaning they are continually reinvesting their earnings at ever-higher rates of return. In light of that, when we looked at Shreyans Industries (NSE:SHREYANIND) and its ROCE trend, we weren't exactly thrilled.
What Is Return On Capital Employed (ROCE)?
If you haven't worked with ROCE before, it measures the 'return' (pre-tax profit) a company generates from capital employed in its business. The formula for this calculation on Shreyans Industries is:
Return on Capital Employed = Earnings Before Interest and Tax (EBIT) ÷ (Total Assets - Current Liabilities)
0.19 = ₹840m ÷ (₹5.6b - ₹1.3b) (Based on the trailing twelve months to March 2024).
Thus, Shreyans Industries has an ROCE of 19%. On its own, that's a standard return, however it's much better than the 12% generated by the Forestry industry.
Check out our latest analysis for Shreyans Industries
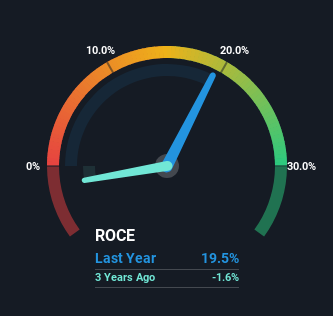
Historical performance is a great place to start when researching a stock so above you can see the gauge for Shreyans Industries' ROCE against it's prior returns. If you're interested in investigating Shreyans Industries' past further, check out this free graph covering Shreyans Industries' past earnings, revenue and cash flow.
What Can We Tell From Shreyans Industries' ROCE Trend?
On the surface, the trend of ROCE at Shreyans Industries doesn't inspire confidence. Around five years ago the returns on capital were 28%, but since then they've fallen to 19%. And considering revenue has dropped while employing more capital, we'd be cautious. If this were to continue, you might be looking at a company that is trying to reinvest for growth but is actually losing market share since sales haven't increased.
Our Take On Shreyans Industries' ROCE
From the above analysis, we find it rather worrisome that returns on capital and sales for Shreyans Industries have fallen, meanwhile the business is employing more capital than it was five years ago. Since the stock has skyrocketed 103% over the last five years, it looks like investors have high expectations of the stock. In any case, the current underlying trends don't bode well for long term performance so unless they reverse, we'd start looking elsewhere.
If you want to continue researching Shreyans Industries, you might be interested to know about the 3 warning signs that our analysis has discovered.
For those who like to invest in solid companies, check out this free list of companies with solid balance sheets and high returns on equity.
New: Manage All Your Stock Portfolios in One Place
We've created the ultimate portfolio companion for stock investors, and it's free.
• Connect an unlimited number of Portfolios and see your total in one currency
• Be alerted to new Warning Signs or Risks via email or mobile
• Track the Fair Value of your stocks
Have feedback on this article? Concerned about the content? Get in touch with us directly. Alternatively, email editorial-team (at) simplywallst.com.
This article by Simply Wall St is general in nature. We provide commentary based on historical data and analyst forecasts only using an unbiased methodology and our articles are not intended to be financial advice. It does not constitute a recommendation to buy or sell any stock, and does not take account of your objectives, or your financial situation. We aim to bring you long-term focused analysis driven by fundamental data. Note that our analysis may not factor in the latest price-sensitive company announcements or qualitative material. Simply Wall St has no position in any stocks mentioned.
About NSEI:SHREYANIND
Shreyans Industries
Engages in the manufacture and sale of writing and printing papers and soda ash in India and internationally.
Flawless balance sheet average dividend payer.
Market Insights

Advertisement
Community Narratives
Finding The True Value Of A Logistics Powerhouse
Fair Value US$95.21|8.4% undervalued
NV
Community Contributor
Paradigm Biopharmaceuticals Will Lead Osteoarthritis Treatment with Zilosul's FDA Success
Fair Value AU$5.50|92.1% undervalued
AM
Community Contributor
Barrick Mining (ABX:CA): A Gold Hedge against a U.S. Shutdown
Fair Value CA$60.00|24.2% undervalued
GM
Community Contributor