
Advertisement
- India
- /
- Paper and Forestry Products
- /
- NSEI:SHREYANIND
Is Shreyans Industries (NSE:SHREYANIND) A Risky Investment?
Warren Buffett famously said, 'Volatility is far from synonymous with risk.' So it might be obvious that you need to consider debt, when you think about how risky any given stock is, because too much debt can sink a company. As with many other companies Shreyans Industries Limited (NSE:SHREYANIND) makes use of debt. But the more important question is: how much risk is that debt creating?
What Risk Does Debt Bring?
Debt assists a business until the business has trouble paying it off, either with new capital or with free cash flow. Ultimately, if the company can't fulfill its legal obligations to repay debt, shareholders could walk away with nothing. However, a more frequent (but still costly) occurrence is where a company must issue shares at bargain-basement prices, permanently diluting shareholders, just to shore up its balance sheet. Having said that, the most common situation is where a company manages its debt reasonably well - and to its own advantage. When we think about a company's use of debt, we first look at cash and debt together.
Check out our latest analysis for Shreyans Industries
What Is Shreyans Industries's Debt?
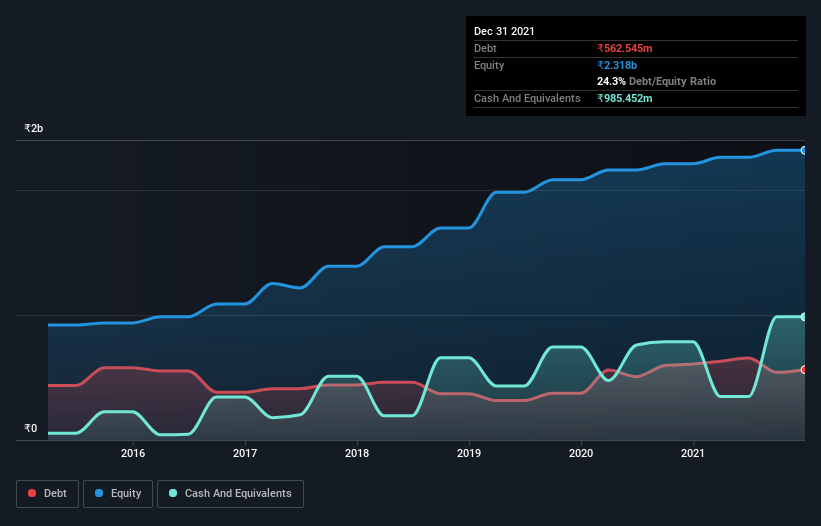
The image below, which you can click on for greater detail, shows that Shreyans Industries had debt of ₹562.5m at the end of September 2021, a reduction from ₹607.3m over a year. However, it does have ₹985.5m in cash offsetting this, leading to net cash of ₹422.9m.
How Strong Is Shreyans Industries' Balance Sheet?
The latest balance sheet data shows that Shreyans Industries had liabilities of ₹1.33b due within a year, and liabilities of ₹530.8m falling due after that. Offsetting this, it had ₹985.5m in cash and ₹259.6m in receivables that were due within 12 months. So it has liabilities totalling ₹615.1m more than its cash and near-term receivables, combined.
Shreyans Industries has a market capitalization of ₹1.51b, so it could very likely raise cash to ameliorate its balance sheet, if the need arose. However, it is still worthwhile taking a close look at its ability to pay off debt. Despite its noteworthy liabilities, Shreyans Industries boasts net cash, so it's fair to say it does not have a heavy debt load!
Notably, Shreyans Industries's EBIT launched higher than Elon Musk, gaining a whopping 143% on last year. There's no doubt that we learn most about debt from the balance sheet. But it is Shreyans Industries's earnings that will influence how the balance sheet holds up in the future. So when considering debt, it's definitely worth looking at the earnings trend. Click here for an interactive snapshot.
Finally, a company can only pay off debt with cold hard cash, not accounting profits. While Shreyans Industries has net cash on its balance sheet, it's still worth taking a look at its ability to convert earnings before interest and tax (EBIT) to free cash flow, to help us understand how quickly it is building (or eroding) that cash balance. In the last three years, Shreyans Industries created free cash flow amounting to 13% of its EBIT, an uninspiring performance. For us, cash conversion that low sparks a little paranoia about is ability to extinguish debt.
Summing up
While Shreyans Industries does have more liabilities than liquid assets, it also has net cash of ₹422.9m. And we liked the look of last year's 143% year-on-year EBIT growth. So we are not troubled with Shreyans Industries's debt use. When analysing debt levels, the balance sheet is the obvious place to start. However, not all investment risk resides within the balance sheet - far from it. For instance, we've identified 4 warning signs for Shreyans Industries (1 is a bit concerning) you should be aware of.
When all is said and done, sometimes its easier to focus on companies that don't even need debt. Readers can access a list of growth stocks with zero net debt 100% free, right now.
New: Manage All Your Stock Portfolios in One Place
We've created the ultimate portfolio companion for stock investors, and it's free.
• Connect an unlimited number of Portfolios and see your total in one currency
• Be alerted to new Warning Signs or Risks via email or mobile
• Track the Fair Value of your stocks
Have feedback on this article? Concerned about the content? Get in touch with us directly. Alternatively, email editorial-team (at) simplywallst.com.
This article by Simply Wall St is general in nature. We provide commentary based on historical data and analyst forecasts only using an unbiased methodology and our articles are not intended to be financial advice. It does not constitute a recommendation to buy or sell any stock, and does not take account of your objectives, or your financial situation. We aim to bring you long-term focused analysis driven by fundamental data. Note that our analysis may not factor in the latest price-sensitive company announcements or qualitative material. Simply Wall St has no position in any stocks mentioned.
About NSEI:SHREYANIND
Shreyans Industries
Engages in the manufacture and sale of writing and printing papers and soda ash in India and internationally.
Flawless balance sheet average dividend payer.
Market Insights

Advertisement
Community Narratives
Finding The True Value Of A Logistics Powerhouse
Fair Value US$95.21|8.4% undervalued
NV
Community Contributor
Paradigm Biopharmaceuticals Will Lead Osteoarthritis Treatment with Zilosul's FDA Success
Fair Value AU$5.50|92.1% undervalued
AM
Community Contributor
Barrick Mining (ABX:CA): A Gold Hedge against a U.S. Shutdown
Fair Value CA$60.00|24.2% undervalued
GM
Community Contributor