
Advertisement
Even With A 30% Surge, Cautious Investors Are Not Rewarding Sampann Utpadan India Limited's (NSE:SAMPANN) Performance Completely
Sampann Utpadan India Limited (NSE:SAMPANN) shareholders would be excited to see that the share price has had a great month, posting a 30% gain and recovering from prior weakness. Looking further back, the 20% rise over the last twelve months isn't too bad notwithstanding the strength over the last 30 days.
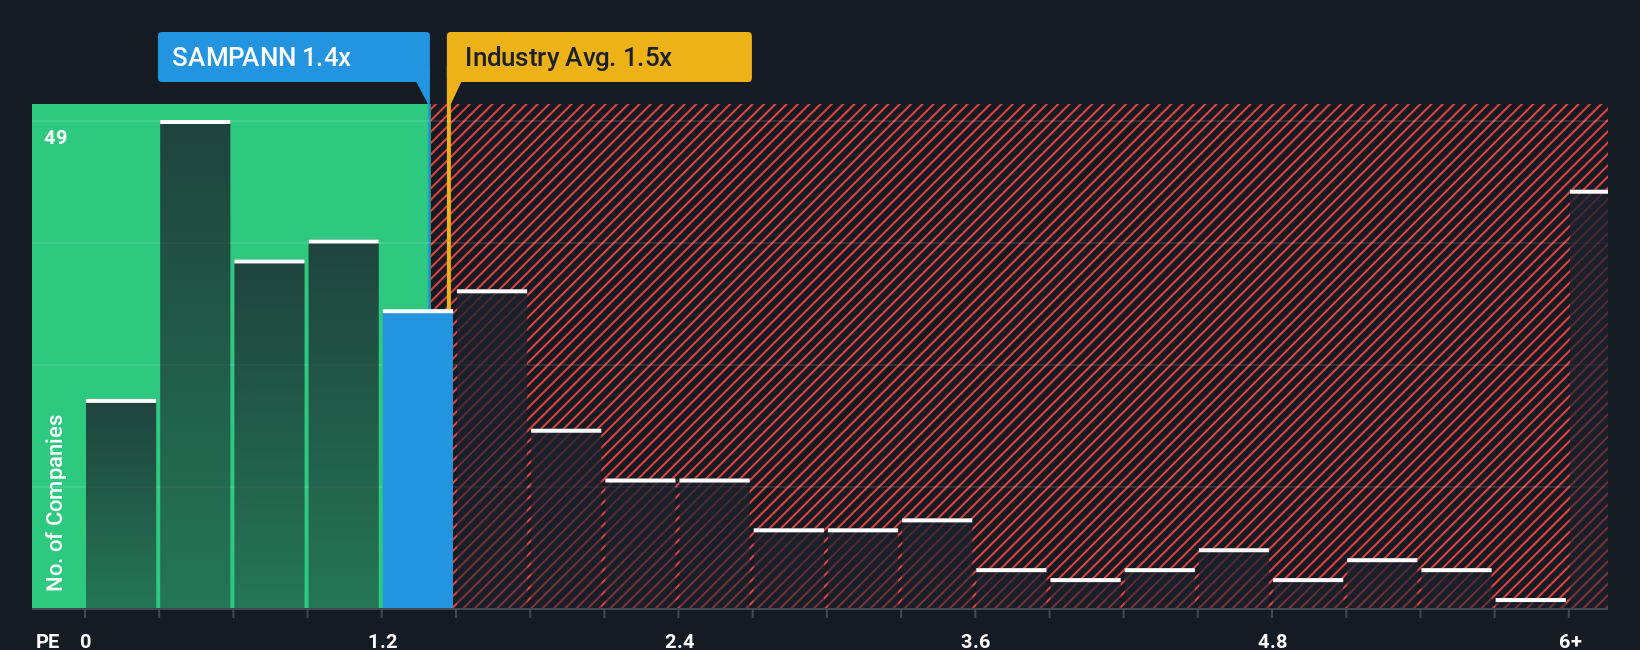
In spite of the firm bounce in price, it's still not a stretch to say that Sampann Utpadan India's price-to-sales (or "P/S") ratio of 1.4x right now seems quite "middle-of-the-road" compared to the Chemicals industry in India, where the median P/S ratio is around 1.5x. Although, it's not wise to simply ignore the P/S without explanation as investors may be disregarding a distinct opportunity or a costly mistake.
See our latest analysis for Sampann Utpadan India
How Has Sampann Utpadan India Performed Recently?
With revenue growth that's exceedingly strong of late, Sampann Utpadan India has been doing very well. Perhaps the market is expecting future revenue performance to taper off, which has kept the P/S from rising. Those who are bullish on Sampann Utpadan India will be hoping that this isn't the case, so that they can pick up the stock at a lower valuation.
We don't have analyst forecasts, but you can see how recent trends are setting up the company for the future by checking out our free report on Sampann Utpadan India's earnings, revenue and cash flow.What Are Revenue Growth Metrics Telling Us About The P/S?
The only time you'd be comfortable seeing a P/S like Sampann Utpadan India's is when the company's growth is tracking the industry closely.
Retrospectively, the last year delivered an exceptional 42% gain to the company's top line. The strong recent performance means it was also able to grow revenue by 104% in total over the last three years. Therefore, it's fair to say the revenue growth recently has been superb for the company.
When compared to the industry's one-year growth forecast of 15%, the most recent medium-term revenue trajectory is noticeably more alluring
In light of this, it's curious that Sampann Utpadan India's P/S sits in line with the majority of other companies. Apparently some shareholders believe the recent performance is at its limits and have been accepting lower selling prices.
The Final Word
Sampann Utpadan India appears to be back in favour with a solid price jump bringing its P/S back in line with other companies in the industry Generally, our preference is to limit the use of the price-to-sales ratio to establishing what the market thinks about the overall health of a company.
To our surprise, Sampann Utpadan India revealed its three-year revenue trends aren't contributing to its P/S as much as we would have predicted, given they look better than current industry expectations. When we see strong revenue with faster-than-industry growth, we can only assume potential risks are what might be placing pressure on the P/S ratio. It appears some are indeed anticipating revenue instability, because the persistence of these recent medium-term conditions would normally provide a boost to the share price.
And what about other risks? Every company has them, and we've spotted 4 warning signs for Sampann Utpadan India (of which 2 are potentially serious!) you should know about.
If you're unsure about the strength of Sampann Utpadan India's business, why not explore our interactive list of stocks with solid business fundamentals for some other companies you may have missed.
New: Manage All Your Stock Portfolios in One Place
We've created the ultimate portfolio companion for stock investors, and it's free.
• Connect an unlimited number of Portfolios and see your total in one currency
• Be alerted to new Warning Signs or Risks via email or mobile
• Track the Fair Value of your stocks
Have feedback on this article? Concerned about the content? Get in touch with us directly. Alternatively, email editorial-team (at) simplywallst.com.
This article by Simply Wall St is general in nature. We provide commentary based on historical data and analyst forecasts only using an unbiased methodology and our articles are not intended to be financial advice. It does not constitute a recommendation to buy or sell any stock, and does not take account of your objectives, or your financial situation. We aim to bring you long-term focused analysis driven by fundamental data. Note that our analysis may not factor in the latest price-sensitive company announcements or qualitative material. Simply Wall St has no position in any stocks mentioned.
About NSEI:SAMPANN
Sampann Utpadan India
Manufactures and sells reclaimed rubber products in India.
Moderate risk and slightly overvalued.
Market Insights

Advertisement
Weekly Picks
FA

FAI on Arabian Internet and Communication Services ·
Solutions by stc: 34% Upside in Saudi's Digital Transformation Leader
Fair Value:ر.س342.2335.5% undervalued
10 followersusers have followed this narrative
1 commentusers have commented on this narrative
4 likesusers have liked this narrative
RO


RobertoAllende on NVIDIA ·
The AI Infrastructure Giant Grows Into Its Valuation
Fair Value:US$345.0747.9% undervalued
28 followersusers have followed this narrative
28 commentsusers have commented on this narrative
21 likesusers have liked this narrative
Recently Updated Narratives
TA

Talos on NVIDIA ·
Not a Bubble, But the "Industrial Revolution 4.0" Engine
Fair Value:US$294.9239.0% undervalued
1 followerusers have followed this narrative
0 commentsusers have commented on this narrative
0 likesusers have liked this narrative
TA

Talos on Advanced Micro Devices ·
The "David vs. Goliath" AI Trade – Why Second Place is Worth Billions
Fair Value:US$416.4647.2% undervalued
2 followersusers have followed this narrative
0 commentsusers have commented on this narrative
0 likesusers have liked this narrative
TA

Talos on PayPal Holdings ·
The "Sleeping Giant" Wakes Up – Efficiency & Monetization
Fair Value:US$174.9264.2% undervalued
5 followersusers have followed this narrative
0 commentsusers have commented on this narrative
0 likesusers have liked this narrative
Popular Narratives
TH


TheWallstreetKing on MicroVision ·
MicroVision will explode future revenue by 380.37% with a vision towards success
Fair Value:US$6098.6% undervalued
111 followersusers have followed this narrative
11 commentsusers have commented on this narrative
22 likesusers have liked this narrative
AN

AnalystConsensusTarget on NVIDIA ·
NVDA: Expanding AI Demand Will Drive Major Data Center Investments Through 2026
Fair Value:US$250.3928.1% undervalued
945 followersusers have followed this narrative
6 commentsusers have commented on this narrative
24 likesusers have liked this narrative
OS


oscargarcia on Alphabet ·
The company that turned a verb into a global necessity and basically runs the modern internet, digital ads, smartphones, maps, and AI.
Fair Value:US$3407.4% undervalued
146 followersusers have followed this narrative
6 commentsusers have commented on this narrative
18 likesusers have liked this narrative