
David Iben put it well when he said, 'Volatility is not a risk we care about. What we care about is avoiding the permanent loss of capital.' It's only natural to consider a company's balance sheet when you examine how risky it is, since debt is often involved when a business collapses. We note that The KCP Limited (NSE:KCP) does have debt on its balance sheet. But the real question is whether this debt is making the company risky.
When Is Debt A Problem?
Debt and other liabilities become risky for a business when it cannot easily fulfill those obligations, either with free cash flow or by raising capital at an attractive price. If things get really bad, the lenders can take control of the business. However, a more frequent (but still costly) occurrence is where a company must issue shares at bargain-basement prices, permanently diluting shareholders, just to shore up its balance sheet. Having said that, the most common situation is where a company manages its debt reasonably well - and to its own advantage. When we think about a company's use of debt, we first look at cash and debt together.
See our latest analysis for KCP
What Is KCP's Debt?
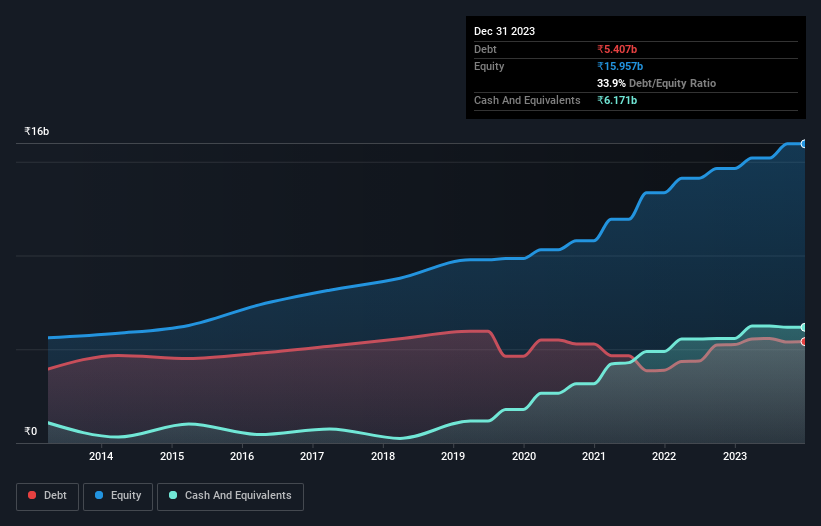
As you can see below, KCP had ₹5.41b of debt, at September 2023, which is about the same as the year before. You can click the chart for greater detail. But on the other hand it also has ₹6.17b in cash, leading to a ₹764.1m net cash position.
A Look At KCP's Liabilities
We can see from the most recent balance sheet that KCP had liabilities of ₹7.65b falling due within a year, and liabilities of ₹2.70b due beyond that. Offsetting this, it had ₹6.17b in cash and ₹2.51b in receivables that were due within 12 months. So it has liabilities totalling ₹1.66b more than its cash and near-term receivables, combined.
Since publicly traded KCP shares are worth a total of ₹20.4b, it seems unlikely that this level of liabilities would be a major threat. Having said that, it's clear that we should continue to monitor its balance sheet, lest it change for the worse. While it does have liabilities worth noting, KCP also has more cash than debt, so we're pretty confident it can manage its debt safely.
Even more impressive was the fact that KCP grew its EBIT by 167% over twelve months. That boost will make it even easier to pay down debt going forward. There's no doubt that we learn most about debt from the balance sheet. But you can't view debt in total isolation; since KCP will need earnings to service that debt. So when considering debt, it's definitely worth looking at the earnings trend. Click here for an interactive snapshot.
Finally, while the tax-man may adore accounting profits, lenders only accept cold hard cash. While KCP has net cash on its balance sheet, it's still worth taking a look at its ability to convert earnings before interest and tax (EBIT) to free cash flow, to help us understand how quickly it is building (or eroding) that cash balance. Over the last three years, KCP reported free cash flow worth 14% of its EBIT, which is really quite low. That limp level of cash conversion undermines its ability to manage and pay down debt.
Summing Up
We could understand if investors are concerned about KCP's liabilities, but we can be reassured by the fact it has has net cash of ₹764.1m. And it impressed us with its EBIT growth of 167% over the last year. So we don't think KCP's use of debt is risky. Of course, we wouldn't say no to the extra confidence that we'd gain if we knew that KCP insiders have been buying shares: if you're on the same wavelength, you can find out if insiders are buying by clicking this link.
If you're interested in investing in businesses that can grow profits without the burden of debt, then check out this free list of growing businesses that have net cash on the balance sheet.
The New Payments ETF Is Live on NASDAQ:
Money is moving to real-time rails, and a newly listed ETF now gives investors direct exposure. Fast settlement. Institutional custody. Simple access.
Explore how this launch could reshape portfolios
Sponsored ContentValuation is complex, but we're here to simplify it.
Discover if KCP might be undervalued or overvalued with our detailed analysis, featuring fair value estimates, potential risks, dividends, insider trades, and its financial condition.
Access Free AnalysisHave feedback on this article? Concerned about the content? Get in touch with us directly. Alternatively, email editorial-team (at) simplywallst.com.
This article by Simply Wall St is general in nature. We provide commentary based on historical data and analyst forecasts only using an unbiased methodology and our articles are not intended to be financial advice. It does not constitute a recommendation to buy or sell any stock, and does not take account of your objectives, or your financial situation. We aim to bring you long-term focused analysis driven by fundamental data. Note that our analysis may not factor in the latest price-sensitive company announcements or qualitative material. Simply Wall St has no position in any stocks mentioned.
About NSEI:KCP
KCP
Engages in cement, heavy engineering, power generation, and hospitality businesses in India.
Excellent balance sheet and slightly overvalued.
Similar Companies
Market Insights

Weekly Picks

Early mover in a fast growing industry. Likely to experience share price volatility as they scale


A case for CA$31.80 (undiluted), aka 8,616% upside from CA$0.37 (an 86 bagger!).


Moderation and Stabilisation: HOLD: Fair Price based on a 4-year Cycle is $12.08
Recently Updated Narratives

Airbnb Stock: Platform Growth in a World of Saturation and Scrutiny

Adobe Stock: AI-Fueled ARR Growth Pushes Guidance Higher, But Cost Pressures Loom

Thomson Reuters Stock: When Legal Intelligence Becomes Mission-Critical Infrastructure
Popular Narratives


Crazy Undervalued 42 Baggers Silver Play (Active & Running Mine)


NVDA: Expanding AI Demand Will Drive Major Data Center Investments Through 2026

The AI Infrastructure Giant Grows Into Its Valuation
Trending Discussion


