
Advertisement
- India
- /
- Basic Materials
- /
- NSEI:KAKATCEM
Is Kakatiya Cement Sugar and Industries (NSE:KAKATCEM) Struggling?
What financial metrics can indicate to us that a company is maturing or even in decline? Businesses in decline often have two underlying trends, firstly, a declining return on capital employed (ROCE) and a declining base of capital employed. This indicates to us that the business is not only shrinking the size of its net assets, but its returns are falling as well. So after we looked into Kakatiya Cement Sugar and Industries (NSE:KAKATCEM), the trends above didn't look too great.
Return On Capital Employed (ROCE): What is it?
For those who don't know, ROCE is a measure of a company's yearly pre-tax profit (its return), relative to the capital employed in the business. The formula for this calculation on Kakatiya Cement Sugar and Industries is:
Return on Capital Employed = Earnings Before Interest and Tax (EBIT) ÷ (Total Assets - Current Liabilities)
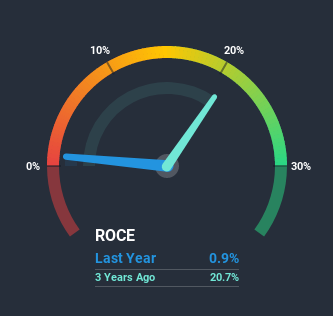
0.0089 = ₹21m ÷ (₹3.0b - ₹713m) (Based on the trailing twelve months to September 2020).
Therefore, Kakatiya Cement Sugar and Industries has an ROCE of 0.9%. In absolute terms, that's a low return and it also under-performs the Basic Materials industry average of 11%.
See our latest analysis for Kakatiya Cement Sugar and Industries
While the past is not representative of the future, it can be helpful to know how a company has performed historically, which is why we have this chart above. If you'd like to look at how Kakatiya Cement Sugar and Industries has performed in the past in other metrics, you can view this free graph of past earnings, revenue and cash flow.
What The Trend Of ROCE Can Tell Us
In terms of Kakatiya Cement Sugar and Industries' historical ROCE movements, the trend doesn't inspire confidence. To be more specific, the ROCE was 6.5% five years ago, but since then it has dropped noticeably. And on the capital employed front, the business is utilizing roughly the same amount of capital as it was back then. Since returns are falling and the business has the same amount of assets employed, this can suggest it's a mature business that hasn't had much growth in the last five years. So because these trends aren't typically conducive to creating a multi-bagger, we wouldn't hold our breath on Kakatiya Cement Sugar and Industries becoming one if things continue as they have.
While on the subject, we noticed that the ratio of current liabilities to total assets has risen to 23%, which has impacted the ROCE. Without this increase, it's likely that ROCE would be even lower than 0.9%. While the ratio isn't currently too high, it's worth keeping an eye on this because if it gets particularly high, the business could then face some new elements of risk.In Conclusion...
In the end, the trend of lower returns on the same amount of capital isn't typically an indication that we're looking at a growth stock. In spite of that, the stock has delivered a 35% return to shareholders who held over the last five years. Either way, we aren't huge fans of the current trends and so with that we think you might find better investments elsewhere.
If you'd like to know more about Kakatiya Cement Sugar and Industries, we've spotted 4 warning signs, and 1 of them makes us a bit uncomfortable.
While Kakatiya Cement Sugar and Industries may not currently earn the highest returns, we've compiled a list of companies that currently earn more than 25% return on equity. Check out this free list here.
If you’re looking to trade Kakatiya Cement Sugar and Industries, open an account with the lowest-cost* platform trusted by professionals, Interactive Brokers. Their clients from over 200 countries and territories trade stocks, options, futures, forex, bonds and funds worldwide from a single integrated account. Promoted
Valuation is complex, but we're here to simplify it.
Discover if Kakatiya Cement Sugar and Industries might be undervalued or overvalued with our detailed analysis, featuring fair value estimates, potential risks, dividends, insider trades, and its financial condition.
Access Free AnalysisThis article by Simply Wall St is general in nature. It does not constitute a recommendation to buy or sell any stock, and does not take account of your objectives, or your financial situation. We aim to bring you long-term focused analysis driven by fundamental data. Note that our analysis may not factor in the latest price-sensitive company announcements or qualitative material. Simply Wall St has no position in any stocks mentioned.
*Interactive Brokers Rated Lowest Cost Broker by StockBrokers.com Annual Online Review 2020
Have feedback on this article? Concerned about the content? Get in touch with us directly. Alternatively, email editorial-team@simplywallst.com.
About NSEI:KAKATCEM
Kakatiya Cement Sugar and Industries
Produces, manufactures, refines, and sells Portland cement in India.
Excellent balance sheet average dividend payer.
Similar Companies
Market Insights

Advertisement
Community Narratives
MINISO's fair value is projected at 26.69 with an anticipated PE ratio shift of 20x
Fair Value US$24.03|9.0% undervalued
BE
Community Contributor
Procter & Gamble: A Dividend Giant Facing Slowing Growth
Fair Value US$119.81|23.5% overvalued
AN
Community Contributor
Eli Lilly's Future Growth Driven by Tirzepatide and Favorable Market Conditions
Fair Value US$1.19k|14.4% undervalued
EA
Community Contributor