Stock Analysis
- India
- /
- Basic Materials
- /
- NSEI:JKCEMENT
J.K. Cement (NSE:JKCEMENT) shareholders have earned a 32% CAGR over the last five years


When you buy shares in a company, it's worth keeping in mind the possibility that it could fail, and you could lose your money. But on the bright side, if you buy shares in a high quality company at the right price, you can gain well over 100%. One great example is J.K. Cement Limited (NSE:JKCEMENT) which saw its share price drive 283% higher over five years. In the last week the share price is up 2.0%.
Let's take a look at the underlying fundamentals over the longer term, and see if they've been consistent with shareholders returns.
Check out our latest analysis for J.K. Cement
While markets are a powerful pricing mechanism, share prices reflect investor sentiment, not just underlying business performance. One way to examine how market sentiment has changed over time is to look at the interaction between a company's share price and its earnings per share (EPS).
During five years of share price growth, J.K. Cement achieved compound earnings per share (EPS) growth of 22% per year. This EPS growth is lower than the 31% average annual increase in the share price. So it's fair to assume the market has a higher opinion of the business than it did five years ago. That's not necessarily surprising considering the five-year track record of earnings growth.
The company's earnings per share (over time) is depicted in the image below (click to see the exact numbers).
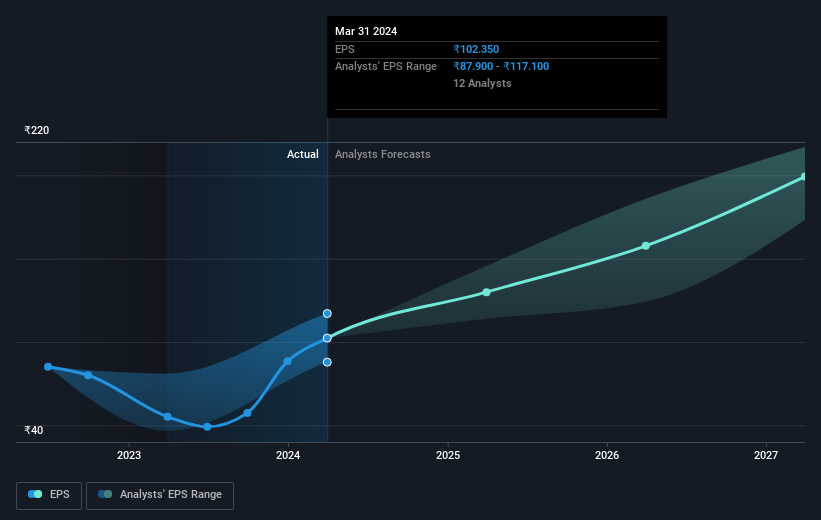
We know that J.K. Cement has improved its bottom line lately, but is it going to grow revenue? Check if analysts think J.K. Cement will grow revenue in the future.
What About Dividends?
When looking at investment returns, it is important to consider the difference between total shareholder return (TSR) and share price return. The TSR incorporates the value of any spin-offs or discounted capital raisings, along with any dividends, based on the assumption that the dividends are reinvested. It's fair to say that the TSR gives a more complete picture for stocks that pay a dividend. In the case of J.K. Cement, it has a TSR of 295% for the last 5 years. That exceeds its share price return that we previously mentioned. This is largely a result of its dividend payments!
A Different Perspective
J.K. Cement provided a TSR of 35% over the last twelve months. But that return falls short of the market. The silver lining is that the gain was actually better than the average annual return of 32% per year over five year. This suggests the company might be improving over time. It's always interesting to track share price performance over the longer term. But to understand J.K. Cement better, we need to consider many other factors. Consider risks, for instance. Every company has them, and we've spotted 2 warning signs for J.K. Cement you should know about.
If you like to buy stocks alongside management, then you might just love this free list of companies. (Hint: many of them are unnoticed AND have attractive valuation).
Please note, the market returns quoted in this article reflect the market weighted average returns of stocks that currently trade on Indian exchanges.
Valuation is complex, but we're helping make it simple.
Find out whether J.K. Cement is potentially over or undervalued by checking out our comprehensive analysis, which includes fair value estimates, risks and warnings, dividends, insider transactions and financial health.
View the Free AnalysisHave feedback on this article? Concerned about the content? Get in touch with us directly. Alternatively, email editorial-team (at) simplywallst.com.
This article by Simply Wall St is general in nature. We provide commentary based on historical data and analyst forecasts only using an unbiased methodology and our articles are not intended to be financial advice. It does not constitute a recommendation to buy or sell any stock, and does not take account of your objectives, or your financial situation. We aim to bring you long-term focused analysis driven by fundamental data. Note that our analysis may not factor in the latest price-sensitive company announcements or qualitative material. Simply Wall St has no position in any stocks mentioned.
About NSEI:JKCEMENT
J.K. Cement
Manufactures and sells cement and its related products under the J.K.
Solid track record with adequate balance sheet and pays a dividend.
