Stock Analysis
- India
- /
- Metals and Mining
- /
- NSEI:JINDALSTEL
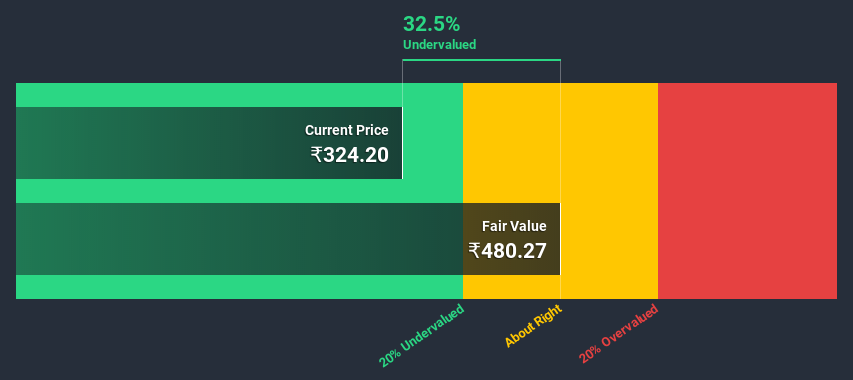
Is There An Opportunity With Jindal Steel & Power Limited's (NSE:JINDALSTEL) 32% Undervaluation?


In this article we are going to estimate the intrinsic value of Jindal Steel & Power Limited (NSE:JINDALSTEL) by taking the forecast future cash flows of the company and discounting them back to today's value. This will be done using the Discounted Cash Flow (DCF) model. Believe it or not, it's not too difficult to follow, as you'll see from our example!
We generally believe that a company's value is the present value of all of the cash it will generate in the future. However, a DCF is just one valuation metric among many, and it is not without flaws. If you want to learn more about discounted cash flow, the rationale behind this calculation can be read in detail in the Simply Wall St analysis model.
Check out our latest analysis for Jindal Steel & Power
Is Jindal Steel & Power fairly valued?
We are going to use a two-stage DCF model, which, as the name states, takes into account two stages of growth. The first stage is generally a higher growth period which levels off heading towards the terminal value, captured in the second 'steady growth' period. To start off with, we need to estimate the next ten years of cash flows. Where possible we use analyst estimates, but when these aren't available we extrapolate the previous free cash flow (FCF) from the last estimate or reported value. We assume companies with shrinking free cash flow will slow their rate of shrinkage, and that companies with growing free cash flow will see their growth rate slow, over this period. We do this to reflect that growth tends to slow more in the early years than it does in later years.
A DCF is all about the idea that a dollar in the future is less valuable than a dollar today, so we need to discount the sum of these future cash flows to arrive at a present value estimate:
10-year free cash flow (FCF) estimate
| 2021 | 2022 | 2023 | 2024 | 2025 | 2026 | 2027 | 2028 | 2029 | 2030 | |
| Levered FCF (₹, Millions) | ₹104.6b | ₹69.6b | ₹58.8b | ₹63.8b | ₹68.8b | ₹74.1b | ₹79.7b | ₹85.5b | ₹91.6b | ₹98.2b |
| Growth Rate Estimate Source | Analyst x9 | Analyst x9 | Analyst x9 | Est @ 8.41% | Est @ 7.98% | Est @ 7.67% | Est @ 7.46% | Est @ 7.31% | Est @ 7.2% | Est @ 7.13% |
| Present Value (₹, Millions) Discounted @ 19% | ₹87.8k | ₹49.1k | ₹34.8k | ₹31.7k | ₹28.7k | ₹26.0k | ₹23.5k | ₹21.1k | ₹19.0k | ₹17.1k |
("Est" = FCF growth rate estimated by Simply Wall St)
Present Value of 10-year Cash Flow (PVCF) = ₹339b
After calculating the present value of future cash flows in the initial 10-year period, we need to calculate the Terminal Value, which accounts for all future cash flows beyond the first stage. For a number of reasons a very conservative growth rate is used that cannot exceed that of a country's GDP growth. In this case we have used the 5-year average of the 10-year government bond yield (7.0%) to estimate future growth. In the same way as with the 10-year 'growth' period, we discount future cash flows to today's value, using a cost of equity of 19%.
Terminal Value (TV)= FCF2030 × (1 + g) ÷ (r – g) = ₹98b× (1 + 7.0%) ÷ (19%– 7.0%) = ₹866b
Present Value of Terminal Value (PVTV)= TV / (1 + r)10= ₹866b÷ ( 1 + 19%)10= ₹151b
The total value, or equity value, is then the sum of the present value of the future cash flows, which in this case is ₹490b. In the final step we divide the equity value by the number of shares outstanding. Relative to the current share price of ₹324, the company appears quite good value at a 32% discount to where the stock price trades currently. Remember though, that this is just an approximate valuation, and like any complex formula - garbage in, garbage out.
The assumptions
We would point out that the most important inputs to a discounted cash flow are the discount rate and of course the actual cash flows. You don't have to agree with these inputs, I recommend redoing the calculations yourself and playing with them. The DCF also does not consider the possible cyclicality of an industry, or a company's future capital requirements, so it does not give a full picture of a company's potential performance. Given that we are looking at Jindal Steel & Power as potential shareholders, the cost of equity is used as the discount rate, rather than the cost of capital (or weighted average cost of capital, WACC) which accounts for debt. In this calculation we've used 19%, which is based on a levered beta of 1.433. Beta is a measure of a stock's volatility, compared to the market as a whole. We get our beta from the industry average beta of globally comparable companies, with an imposed limit between 0.8 and 2.0, which is a reasonable range for a stable business.
Moving On:
Whilst important, the DCF calculation shouldn't be the only metric you look at when researching a company. DCF models are not the be-all and end-all of investment valuation. Preferably you'd apply different cases and assumptions and see how they would impact the company's valuation. For instance, if the terminal value growth rate is adjusted slightly, it can dramatically alter the overall result. Why is the intrinsic value higher than the current share price? For Jindal Steel & Power, we've compiled three essential elements you should look at:
- Risks: You should be aware of the 3 warning signs for Jindal Steel & Power (2 are potentially serious!) we've uncovered before considering an investment in the company.
- Future Earnings: How does JINDALSTEL's growth rate compare to its peers and the wider market? Dig deeper into the analyst consensus number for the upcoming years by interacting with our free analyst growth expectation chart.
- Other High Quality Alternatives: Do you like a good all-rounder? Explore our interactive list of high quality stocks to get an idea of what else is out there you may be missing!
PS. The Simply Wall St app conducts a discounted cash flow valuation for every stock on the NSEI every day. If you want to find the calculation for other stocks just search here.
If you’re looking to trade Jindal Steel & Power, open an account with the lowest-cost* platform trusted by professionals, Interactive Brokers. Their clients from over 200 countries and territories trade stocks, options, futures, forex, bonds and funds worldwide from a single integrated account. Promoted
Valuation is complex, but we're helping make it simple.
Find out whether Jindal Steel & Power is potentially over or undervalued by checking out our comprehensive analysis, which includes fair value estimates, risks and warnings, dividends, insider transactions and financial health.
View the Free AnalysisThis article by Simply Wall St is general in nature. It does not constitute a recommendation to buy or sell any stock, and does not take account of your objectives, or your financial situation. We aim to bring you long-term focused analysis driven by fundamental data. Note that our analysis may not factor in the latest price-sensitive company announcements or qualitative material. Simply Wall St has no position in any stocks mentioned.
*Interactive Brokers Rated Lowest Cost Broker by StockBrokers.com Annual Online Review 2020
Have feedback on this article? Concerned about the content? Get in touch with us directly. Alternatively, email editorial-team (at) simplywallst.com.
About NSEI:JINDALSTEL
Jindal Steel & Power
Operates in the steel, mining, and infrastructure sectors in India and internationally.
Undervalued with solid track record.
