
Advertisement
- India
- /
- Metals and Mining
- /
- NSEI:GPIL
A Look At The Fair Value Of Godawari Power & Ispat Limited (NSE:GPIL)
Key Insights
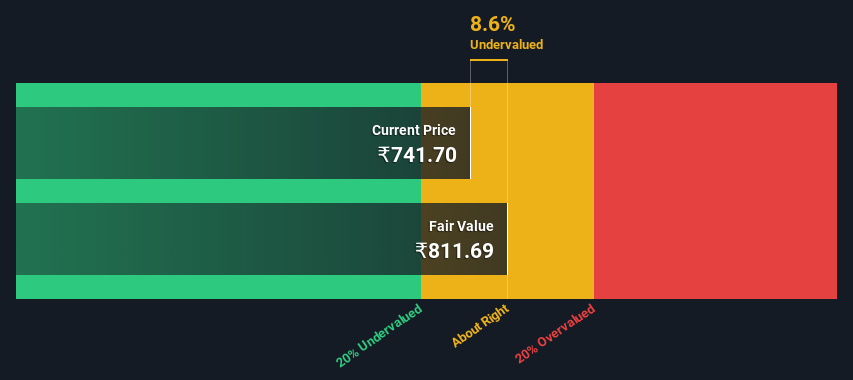
- Godawari Power & Ispat's estimated fair value is ₹812 based on 2 Stage Free Cash Flow to Equity
- With ₹742 share price, Godawari Power & Ispat appears to be trading close to its estimated fair value
- Peers of Godawari Power & Ispat are currently trading on average at a 331% premium
How far off is Godawari Power & Ispat Limited (NSE:GPIL) from its intrinsic value? Using the most recent financial data, we'll take a look at whether the stock is fairly priced by projecting its future cash flows and then discounting them to today's value. We will take advantage of the Discounted Cash Flow (DCF) model for this purpose. Believe it or not, it's not too difficult to follow, as you'll see from our example!
Companies can be valued in a lot of ways, so we would point out that a DCF is not perfect for every situation. If you still have some burning questions about this type of valuation, take a look at the Simply Wall St analysis model.
View our latest analysis for Godawari Power & Ispat
The Calculation
We use what is known as a 2-stage model, which simply means we have two different periods of growth rates for the company's cash flows. Generally the first stage is higher growth, and the second stage is a lower growth phase. To begin with, we have to get estimates of the next ten years of cash flows. Seeing as no analyst estimates of free cash flow are available to us, we have extrapolate the previous free cash flow (FCF) from the company's last reported value. We assume companies with shrinking free cash flow will slow their rate of shrinkage, and that companies with growing free cash flow will see their growth rate slow, over this period. We do this to reflect that growth tends to slow more in the early years than it does in later years.
Generally we assume that a dollar today is more valuable than a dollar in the future, so we discount the value of these future cash flows to their estimated value in today's dollars:
10-year free cash flow (FCF) forecast
| 2024 | 2025 | 2026 | 2027 | 2028 | 2029 | 2030 | 2031 | 2032 | 2033 | |
| Levered FCF (₹, Millions) | ₹9.24b | ₹10.00b | ₹10.8b | ₹11.6b | ₹12.4b | ₹13.3b | ₹14.2b | ₹15.2b | ₹16.2b | ₹17.3b |
| Growth Rate Estimate Source | Est @ 8.81% | Est @ 8.18% | Est @ 7.74% | Est @ 7.43% | Est @ 7.21% | Est @ 7.06% | Est @ 6.96% | Est @ 6.88% | Est @ 6.83% | Est @ 6.79% |
| Present Value (₹, Millions) Discounted @ 15% | ₹8.0k | ₹7.5k | ₹7.0k | ₹6.5k | ₹6.1k | ₹5.6k | ₹5.2k | ₹4.8k | ₹4.5k | ₹4.1k |
("Est" = FCF growth rate estimated by Simply Wall St)
Present Value of 10-year Cash Flow (PVCF) = ₹59b
We now need to calculate the Terminal Value, which accounts for all the future cash flows after this ten year period. For a number of reasons a very conservative growth rate is used that cannot exceed that of a country's GDP growth. In this case we have used the 5-year average of the 10-year government bond yield (6.7%) to estimate future growth. In the same way as with the 10-year 'growth' period, we discount future cash flows to today's value, using a cost of equity of 15%.
Terminal Value (TV)= FCF2033 × (1 + g) ÷ (r – g) = ₹17b× (1 + 6.7%) ÷ (15%– 6.7%) = ₹213b
Present Value of Terminal Value (PVTV)= TV / (1 + r)10= ₹213b÷ ( 1 + 15%)10= ₹51b
The total value, or equity value, is then the sum of the present value of the future cash flows, which in this case is ₹110b. To get the intrinsic value per share, we divide this by the total number of shares outstanding. Compared to the current share price of ₹742, the company appears about fair value at a 8.6% discount to where the stock price trades currently. Remember though, that this is just an approximate valuation, and like any complex formula - garbage in, garbage out.
The Assumptions
We would point out that the most important inputs to a discounted cash flow are the discount rate and of course the actual cash flows. You don't have to agree with these inputs, I recommend redoing the calculations yourself and playing with them. The DCF also does not consider the possible cyclicality of an industry, or a company's future capital requirements, so it does not give a full picture of a company's potential performance. Given that we are looking at Godawari Power & Ispat as potential shareholders, the cost of equity is used as the discount rate, rather than the cost of capital (or weighted average cost of capital, WACC) which accounts for debt. In this calculation we've used 15%, which is based on a levered beta of 1.111. Beta is a measure of a stock's volatility, compared to the market as a whole. We get our beta from the industry average beta of globally comparable companies, with an imposed limit between 0.8 and 2.0, which is a reasonable range for a stable business.
SWOT Analysis for Godawari Power & Ispat
Strength
- Debt is not viewed as a risk.
- Dividends are covered by earnings and cash flows.
Weakness
- Earnings declined over the past year.
- Dividend is low compared to the top 25% of dividend payers in the Metals and Mining market.
Opportunity
- Annual earnings are forecast to grow faster than the Indian market.
- Good value based on P/E ratio and estimated fair value.
Threat
- No apparent threats visible for GPIL.
Moving On:
Whilst important, the DCF calculation shouldn't be the only metric you look at when researching a company. It's not possible to obtain a foolproof valuation with a DCF model. Instead the best use for a DCF model is to test certain assumptions and theories to see if they would lead to the company being undervalued or overvalued. If a company grows at a different rate, or if its cost of equity or risk free rate changes sharply, the output can look very different. For Godawari Power & Ispat, we've put together three essential aspects you should further research:
- Risks: As an example, we've found 1 warning sign for Godawari Power & Ispat that you need to consider before investing here.
- Future Earnings: How does GPIL's growth rate compare to its peers and the wider market? Dig deeper into the analyst consensus number for the upcoming years by interacting with our free analyst growth expectation chart.
- Other High Quality Alternatives: Do you like a good all-rounder? Explore our interactive list of high quality stocks to get an idea of what else is out there you may be missing!
PS. The Simply Wall St app conducts a discounted cash flow valuation for every stock on the NSEI every day. If you want to find the calculation for other stocks just search here.
New: Manage All Your Stock Portfolios in One Place
We've created the ultimate portfolio companion for stock investors, and it's free.
• Connect an unlimited number of Portfolios and see your total in one currency
• Be alerted to new Warning Signs or Risks via email or mobile
• Track the Fair Value of your stocks
Have feedback on this article? Concerned about the content? Get in touch with us directly. Alternatively, email editorial-team (at) simplywallst.com.
This article by Simply Wall St is general in nature. We provide commentary based on historical data and analyst forecasts only using an unbiased methodology and our articles are not intended to be financial advice. It does not constitute a recommendation to buy or sell any stock, and does not take account of your objectives, or your financial situation. We aim to bring you long-term focused analysis driven by fundamental data. Note that our analysis may not factor in the latest price-sensitive company announcements or qualitative material. Simply Wall St has no position in any stocks mentioned.
About NSEI:GPIL
Flawless balance sheet with reasonable growth potential and pays a dividend.
Similar Companies
Market Insights

Advertisement
Community Narratives
MINISO's fair value is projected at 26.69 with an anticipated PE ratio shift of 20x
Fair Value US$24.03|11.0% undervalued
BE
Community Contributor
Procter & Gamble: A Dividend Giant Facing Slowing Growth
Fair Value US$119.81|23.3% overvalued
AN
Community Contributor
Eli Lilly's Future Growth Driven by Tirzepatide and Favorable Market Conditions
Fair Value US$1.19k|13.8% undervalued
EA
Community Contributor