
Advertisement

Finding a business that has the potential to grow substantially is not easy, but it is possible if we look at a few key financial metrics. One common approach is to try and find a company with returns on capital employed (ROCE) that are increasing, in conjunction with a growing amount of capital employed. Put simply, these types of businesses are compounding machines, meaning they are continually reinvesting their earnings at ever-higher rates of return. That's why when we briefly looked at Goodluck India's (NSE:GOODLUCK) ROCE trend, we were pretty happy with what we saw.
What Is Return On Capital Employed (ROCE)?
For those who don't know, ROCE is a measure of a company's yearly pre-tax profit (its return), relative to the capital employed in the business. Analysts use this formula to calculate it for Goodluck India:
Return on Capital Employed = Earnings Before Interest and Tax (EBIT) ÷ (Total Assets - Current Liabilities)
0.18 = ₹2.6b ÷ (₹23b - ₹8.8b) (Based on the trailing twelve months to December 2024).
Therefore, Goodluck India has an ROCE of 18%. On its own, that's a standard return, however it's much better than the 14% generated by the Metals and Mining industry.
See our latest analysis for Goodluck India
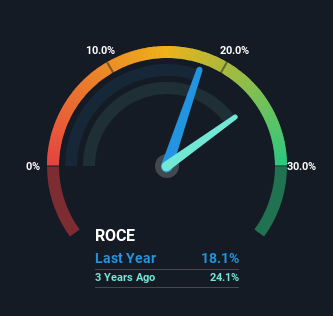
Historical performance is a great place to start when researching a stock so above you can see the gauge for Goodluck India's ROCE against it's prior returns. If you'd like to look at how Goodluck India has performed in the past in other metrics, you can view this free graph of Goodluck India's past earnings, revenue and cash flow.
What The Trend Of ROCE Can Tell Us
The trend of ROCE doesn't stand out much, but returns on a whole are decent. The company has consistently earned 18% for the last five years, and the capital employed within the business has risen 191% in that time. 18% is a pretty standard return, and it provides some comfort knowing that Goodluck India has consistently earned this amount. Over long periods of time, returns like these might not be too exciting, but with consistency they can pay off in terms of share price returns.
On a side note, Goodluck India has done well to reduce current liabilities to 38% of total assets over the last five years. This can eliminate some of the risks inherent in the operations because the business has less outstanding obligations to their suppliers and or short-term creditors than they did previously.
What We Can Learn From Goodluck India's ROCE
In the end, Goodluck India has proven its ability to adequately reinvest capital at good rates of return. On top of that, the stock has rewarded shareholders with a remarkable 2,832% return to those who've held over the last five years. So while the positive underlying trends may be accounted for by investors, we still think this stock is worth looking into further.
If you want to know some of the risks facing Goodluck India we've found 2 warning signs (1 doesn't sit too well with us!) that you should be aware of before investing here.
While Goodluck India may not currently earn the highest returns, we've compiled a list of companies that currently earn more than 25% return on equity. Check out this free list here.
New: Manage All Your Stock Portfolios in One Place
We've created the ultimate portfolio companion for stock investors, and it's free.
• Connect an unlimited number of Portfolios and see your total in one currency
• Be alerted to new Warning Signs or Risks via email or mobile
• Track the Fair Value of your stocks
Have feedback on this article? Concerned about the content? Get in touch with us directly. Alternatively, email editorial-team (at) simplywallst.com.
This article by Simply Wall St is general in nature. We provide commentary based on historical data and analyst forecasts only using an unbiased methodology and our articles are not intended to be financial advice. It does not constitute a recommendation to buy or sell any stock, and does not take account of your objectives, or your financial situation. We aim to bring you long-term focused analysis driven by fundamental data. Note that our analysis may not factor in the latest price-sensitive company announcements or qualitative material. Simply Wall St has no position in any stocks mentioned.
About NSEI:GOODLUCK
Goodluck India
Manufactures and supplies precision engineering and steel products in India.
Adequate balance sheet slight.
Similar Companies
Market Insights


Advertisement
Community Narratives
A case for TSXV:USA to reach USD $5.00 - $9.00 (CAD $7.30–$12.29) by 2029.
Fair Value CA$12.29|91.2% undervalued
AG
Community Contributor
DLocal's Future Growth Fueled by 35% Revenue and Profit Margin Boosts
Fair Value US$195.39|94.1% undervalued
WY
Community Contributor
Historically Cheap, but the Margin of Safety Is Still Thin
Fair Value SEK 232.58|12.7% undervalued
MA
Community Contributor