
Advertisement
Calculating The Intrinsic Value Of Excel Industries Limited (NSE:EXCELINDUS)
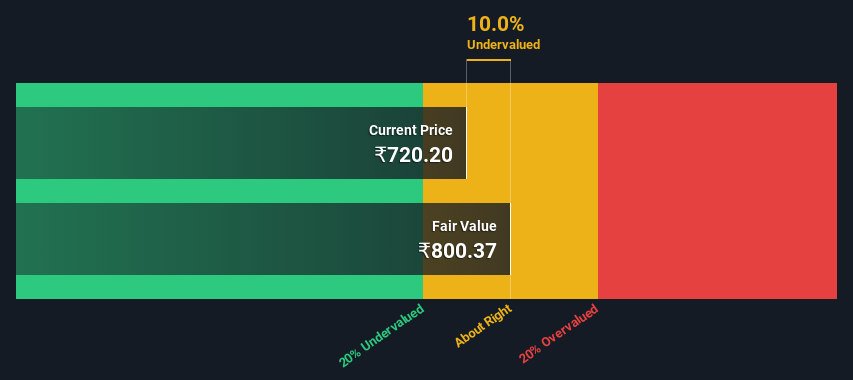
Key Insights
- Using the 2 Stage Free Cash Flow to Equity, Excel Industries fair value estimate is ₹800
- Current share price of ₹720 suggests Excel Industries is potentially trading close to its fair value
- The average premium for Excel Industries' competitorsis currently 578%
Today we will run through one way of estimating the intrinsic value of Excel Industries Limited (NSE:EXCELINDUS) by taking the expected future cash flows and discounting them to their present value. We will use the Discounted Cash Flow (DCF) model on this occasion. Believe it or not, it's not too difficult to follow, as you'll see from our example!
We generally believe that a company's value is the present value of all of the cash it will generate in the future. However, a DCF is just one valuation metric among many, and it is not without flaws. For those who are keen learners of equity analysis, the Simply Wall St analysis model here may be something of interest to you.
Check out our latest analysis for Excel Industries
Is Excel Industries Fairly Valued?
We're using the 2-stage growth model, which simply means we take in account two stages of company's growth. In the initial period the company may have a higher growth rate and the second stage is usually assumed to have a stable growth rate. To begin with, we have to get estimates of the next ten years of cash flows. Seeing as no analyst estimates of free cash flow are available to us, we have extrapolate the previous free cash flow (FCF) from the company's last reported value. We assume companies with shrinking free cash flow will slow their rate of shrinkage, and that companies with growing free cash flow will see their growth rate slow, over this period. We do this to reflect that growth tends to slow more in the early years than it does in later years.
A DCF is all about the idea that a dollar in the future is less valuable than a dollar today, so we discount the value of these future cash flows to their estimated value in today's dollars:
10-year free cash flow (FCF) estimate
| 2024 | 2025 | 2026 | 2027 | 2028 | 2029 | 2030 | 2031 | 2032 | 2033 | |
| Levered FCF (₹, Millions) | ₹690.0m | ₹759.1m | ₹827.6m | ₹896.4m | ₹966.7m | ₹1.04b | ₹1.11b | ₹1.19b | ₹1.28b | ₹1.37b |
| Growth Rate Estimate Source | Est @ 11.42% | Est @ 10.01% | Est @ 9.02% | Est @ 8.33% | Est @ 7.84% | Est @ 7.50% | Est @ 7.26% | Est @ 7.10% | Est @ 6.98% | Est @ 6.90% |
| Present Value (₹, Millions) Discounted @ 14% | ₹605 | ₹583 | ₹556 | ₹528 | ₹499 | ₹470 | ₹441 | ₹414 | ₹388 | ₹364 |
("Est" = FCF growth rate estimated by Simply Wall St)
Present Value of 10-year Cash Flow (PVCF) = ₹4.8b
We now need to calculate the Terminal Value, which accounts for all the future cash flows after this ten year period. For a number of reasons a very conservative growth rate is used that cannot exceed that of a country's GDP growth. In this case we have used the 5-year average of the 10-year government bond yield (6.7%) to estimate future growth. In the same way as with the 10-year 'growth' period, we discount future cash flows to today's value, using a cost of equity of 14%.
Terminal Value (TV)= FCF2033 × (1 + g) ÷ (r – g) = ₹1.4b× (1 + 6.7%) ÷ (14%– 6.7%) = ₹20b
Present Value of Terminal Value (PVTV)= TV / (1 + r)10= ₹20b÷ ( 1 + 14%)10= ₹5.2b
The total value is the sum of cash flows for the next ten years plus the discounted terminal value, which results in the Total Equity Value, which in this case is ₹10b. The last step is to then divide the equity value by the number of shares outstanding. Relative to the current share price of ₹720, the company appears about fair value at a 10% discount to where the stock price trades currently. Remember though, that this is just an approximate valuation, and like any complex formula - garbage in, garbage out.
The Assumptions
We would point out that the most important inputs to a discounted cash flow are the discount rate and of course the actual cash flows. If you don't agree with these result, have a go at the calculation yourself and play with the assumptions. The DCF also does not consider the possible cyclicality of an industry, or a company's future capital requirements, so it does not give a full picture of a company's potential performance. Given that we are looking at Excel Industries as potential shareholders, the cost of equity is used as the discount rate, rather than the cost of capital (or weighted average cost of capital, WACC) which accounts for debt. In this calculation we've used 14%, which is based on a levered beta of 0.952. Beta is a measure of a stock's volatility, compared to the market as a whole. We get our beta from the industry average beta of globally comparable companies, with an imposed limit between 0.8 and 2.0, which is a reasonable range for a stable business.
SWOT Analysis for Excel Industries
Strength
- Debt is not viewed as a risk.
- Dividends are covered by earnings and cash flows.
- Dividend is in the top 25% of dividend payers in the market.
Weakness
- Earnings declined over the past year.
Opportunity
- Current share price is below our estimate of fair value.
- Lack of analyst coverage makes it difficult to determine EXCELINDUS' earnings prospects.
Threat
- No apparent threats visible for EXCELINDUS.
Moving On:
Valuation is only one side of the coin in terms of building your investment thesis, and it shouldn't be the only metric you look at when researching a company. DCF models are not the be-all and end-all of investment valuation. Preferably you'd apply different cases and assumptions and see how they would impact the company's valuation. For instance, if the terminal value growth rate is adjusted slightly, it can dramatically alter the overall result. For Excel Industries, we've put together three essential elements you should look at:
- Risks: Case in point, we've spotted 3 warning signs for Excel Industries you should be aware of, and 1 of them is concerning.
- Other Solid Businesses: Low debt, high returns on equity and good past performance are fundamental to a strong business. Why not explore our interactive list of stocks with solid business fundamentals to see if there are other companies you may not have considered!
- Other Environmentally-Friendly Companies: Concerned about the environment and think consumers will buy eco-friendly products more and more? Browse through our interactive list of companies that are thinking about a greener future to discover some stocks you may not have thought of!
PS. Simply Wall St updates its DCF calculation for every Indian stock every day, so if you want to find the intrinsic value of any other stock just search here.
Valuation is complex, but we're here to simplify it.
Discover if Excel Industries might be undervalued or overvalued with our detailed analysis, featuring fair value estimates, potential risks, dividends, insider trades, and its financial condition.
Access Free AnalysisHave feedback on this article? Concerned about the content? Get in touch with us directly. Alternatively, email editorial-team (at) simplywallst.com.
This article by Simply Wall St is general in nature. We provide commentary based on historical data and analyst forecasts only using an unbiased methodology and our articles are not intended to be financial advice. It does not constitute a recommendation to buy or sell any stock, and does not take account of your objectives, or your financial situation. We aim to bring you long-term focused analysis driven by fundamental data. Note that our analysis may not factor in the latest price-sensitive company announcements or qualitative material. Simply Wall St has no position in any stocks mentioned.
About NSEI:EXCELINDUS
Excel Industries
Engages in manufactures and sells chemicals, and environmental and biotech products and services in India and internationally.
Flawless balance sheet average dividend payer.
Similar Companies
Market Insights

Advertisement
Weekly Picks
RO


RockeTeller on Santacruz Silver Mining ·
Crazy Undervalued 42 Baggers Silver Play (Active & Running Mine)
Fair Value:CA$8696.7% undervalued
61 followersusers have followed this narrative
7 commentsusers have commented on this narrative
17 likesusers have liked this narrative
RO


Robbo on Fiducian Group ·
Fiducian: Compliance Clouds or Value Opportunity?
Fair Value:AU$122.0% undervalued
9 followersusers have followed this narrative
0 commentsusers have commented on this narrative
0 likesusers have liked this narrative
WO

woodworthfund on Willamette Valley Vineyards ·
Willamette Valley Vineyards (WVVI): Not-So-Great Value
Fair Value:US$242.5% overvalued
10 followersusers have followed this narrative
0 commentsusers have commented on this narrative
1 likeusers have liked this narrative
Recently Updated Narratives
WO

woodworthfund on MGP Ingredients ·
THE KINGDOM OF BROWN GOODS: WHY MGPI IS BEING CRUSHED BY INVENTORY & PRIMED FOR RESURRECTION
Fair Value:US$4035.8% undervalued
3 followersusers have followed this narrative
0 commentsusers have commented on this narrative
0 likesusers have liked this narrative
DA


davidlsander on Beam Therapeutics ·
The "Molecular Pencil": Why Beam's Technology is Built to Win
Fair Value:US$15081.9% undervalued
53 followersusers have followed this narrative
3 commentsusers have commented on this narrative
1 likeusers have liked this narrative
MO


mo7md on ADNOC Gas ·
ADNOC Gas future shines with a 21.4% revenue surge
Fair Value:د.إ3.728.9% undervalued
3 followersusers have followed this narrative
0 commentsusers have commented on this narrative
0 likesusers have liked this narrative
Popular Narratives
TH


TheWallstreetKing on MicroVision ·
MicroVision will explode future revenue by 380.37% with a vision towards success
Fair Value:US$6098.5% undervalued
117 followersusers have followed this narrative
11 commentsusers have commented on this narrative
22 likesusers have liked this narrative
AN


AnalystConsensusTarget on NVIDIA ·
NVDA: Expanding AI Demand Will Drive Major Data Center Investments Through 2026
Fair Value:US$250.3927.2% undervalued
959 followersusers have followed this narrative
6 commentsusers have commented on this narrative
25 likesusers have liked this narrative
RO
RockeTeller on Santacruz Silver Mining ·
Crazy Undervalued 42 Baggers Silver Play (Active & Running Mine)
Fair Value:CA$8696.7% undervalued
61 followersusers have followed this narrative
7 commentsusers have commented on this narrative
17 likesusers have liked this narrative
