
Advertisement
Is Epigral Limited's (NSE:EPIGRAL) Latest Stock Performance A Reflection Of Its Financial Health?
Epigral's (NSE:EPIGRAL) stock is up by a considerable 49% over the past three months. Since the market usually pay for a company’s long-term fundamentals, we decided to study the company’s key performance indicators to see if they could be influencing the market. In this article, we decided to focus on Epigral's ROE.
Return on equity or ROE is an important factor to be considered by a shareholder because it tells them how effectively their capital is being reinvested. In short, ROE shows the profit each dollar generates with respect to its shareholder investments.
View our latest analysis for Epigral
How Is ROE Calculated?
ROE can be calculated by using the formula:
Return on Equity = Net Profit (from continuing operations) ÷ Shareholders' Equity
So, based on the above formula, the ROE for Epigral is:
20% = ₹2.5b ÷ ₹13b (Based on the trailing twelve months to June 2024).
The 'return' is the yearly profit. That means that for every ₹1 worth of shareholders' equity, the company generated ₹0.20 in profit.
What Has ROE Got To Do With Earnings Growth?
So far, we've learned that ROE is a measure of a company's profitability. Depending on how much of these profits the company reinvests or "retains", and how effectively it does so, we are then able to assess a company’s earnings growth potential. Assuming everything else remains unchanged, the higher the ROE and profit retention, the higher the growth rate of a company compared to companies that don't necessarily bear these characteristics.
Epigral's Earnings Growth And 20% ROE
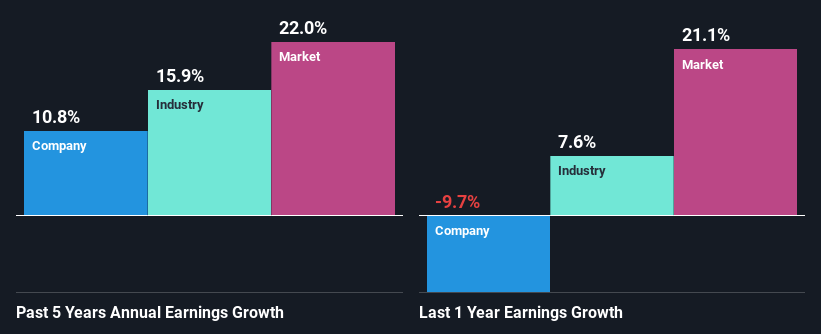
At first glance, Epigral seems to have a decent ROE. Especially when compared to the industry average of 11% the company's ROE looks pretty impressive. This certainly adds some context to Epigral's decent 11% net income growth seen over the past five years.
We then compared Epigral's net income growth with the industry and found that the company's growth figure is lower than the average industry growth rate of 16% in the same 5-year period, which is a bit concerning.
Earnings growth is a huge factor in stock valuation. The investor should try to establish if the expected growth or decline in earnings, whichever the case may be, is priced in. By doing so, they will have an idea if the stock is headed into clear blue waters or if swampy waters await. Is Epigral fairly valued compared to other companies? These 3 valuation measures might help you decide.
Is Epigral Using Its Retained Earnings Effectively?
Epigral has a low three-year median payout ratio of 5.9%, meaning that the company retains the remaining 94% of its profits. This suggests that the management is reinvesting most of the profits to grow the business.
While Epigral has been growing its earnings, it only recently started to pay dividends which likely means that the company decided to impress new and existing shareholders with a dividend. Upon studying the latest analysts' consensus data, we found that the company is expected to keep paying out approximately 6.0% of its profits over the next three years. Accordingly, forecasts suggest that Epigral's future ROE will be 23% which is again, similar to the current ROE.
Conclusion
Overall, we are quite pleased with Epigral's performance. Particularly, we like that the company is reinvesting heavily into its business, and at a high rate of return. As a result, the decent growth in its earnings is not surprising. With that said, the latest industry analyst forecasts reveal that the company's earnings are expected to accelerate. To know more about the latest analysts predictions for the company, check out this visualization of analyst forecasts for the company.
Valuation is complex, but we're here to simplify it.
Discover if Epigral might be undervalued or overvalued with our detailed analysis, featuring fair value estimates, potential risks, dividends, insider trades, and its financial condition.
Access Free AnalysisHave feedback on this article? Concerned about the content? Get in touch with us directly. Alternatively, email editorial-team (at) simplywallst.com.
This article by Simply Wall St is general in nature. We provide commentary based on historical data and analyst forecasts only using an unbiased methodology and our articles are not intended to be financial advice. It does not constitute a recommendation to buy or sell any stock, and does not take account of your objectives, or your financial situation. We aim to bring you long-term focused analysis driven by fundamental data. Note that our analysis may not factor in the latest price-sensitive company announcements or qualitative material. Simply Wall St has no position in any stocks mentioned.
About NSEI:EPIGRAL
Epigral
Manufactures and sells chlor-alkali and related derivatives in India and internationally.
Flawless balance sheet with high growth potential.
Similar Companies
Market Insights

Advertisement
Community Narratives
MINISO's fair value is projected at 26.69 with an anticipated PE ratio shift of 20x
Fair Value US$24.03|11.0% undervalued
BE
Community Contributor
Procter & Gamble: A Dividend Giant Facing Slowing Growth
Fair Value US$119.81|23.3% overvalued
AN
Community Contributor
Eli Lilly's Future Growth Driven by Tirzepatide and Favorable Market Conditions
Fair Value US$1.19k|13.8% undervalued
EA
Community Contributor