
Advertisement
- India
- /
- Basic Materials
- /
- NSEI:BIRLACORPN
Estimating The Intrinsic Value Of Birla Corporation Limited (NSE:BIRLACORPN)
Key Insights
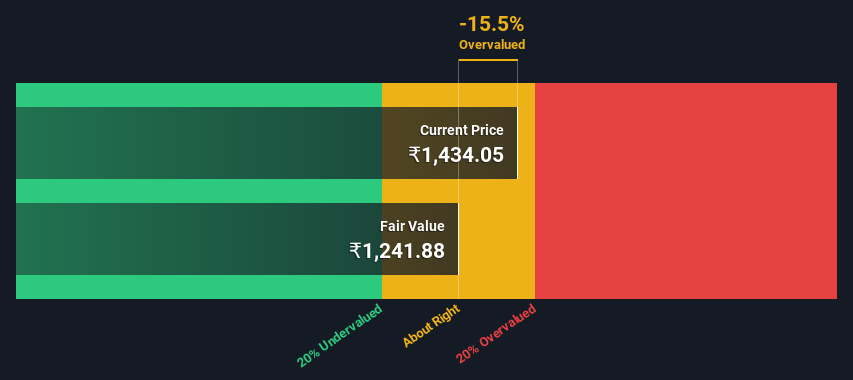
- Using the 2 Stage Free Cash Flow to Equity, Birla fair value estimate is ₹1,242
- With ₹1,434 share price, Birla appears to be trading close to its estimated fair value
- Our fair value estimate is 20% lower than Birla's analyst price target of ₹1,547
Does the December share price for Birla Corporation Limited (NSE:BIRLACORPN) reflect what it's really worth? Today, we will estimate the stock's intrinsic value by estimating the company's future cash flows and discounting them to their present value. The Discounted Cash Flow (DCF) model is the tool we will apply to do this. There's really not all that much to it, even though it might appear quite complex.
Companies can be valued in a lot of ways, so we would point out that a DCF is not perfect for every situation. For those who are keen learners of equity analysis, the Simply Wall St analysis model here may be something of interest to you.
View our latest analysis for Birla
The Model
We are going to use a two-stage DCF model, which, as the name states, takes into account two stages of growth. The first stage is generally a higher growth period which levels off heading towards the terminal value, captured in the second 'steady growth' period. In the first stage we need to estimate the cash flows to the business over the next ten years. Where possible we use analyst estimates, but when these aren't available we extrapolate the previous free cash flow (FCF) from the last estimate or reported value. We assume companies with shrinking free cash flow will slow their rate of shrinkage, and that companies with growing free cash flow will see their growth rate slow, over this period. We do this to reflect that growth tends to slow more in the early years than it does in later years.
Generally we assume that a dollar today is more valuable than a dollar in the future, and so the sum of these future cash flows is then discounted to today's value:
10-year free cash flow (FCF) estimate
| 2024 | 2025 | 2026 | 2027 | 2028 | 2029 | 2030 | 2031 | 2032 | 2033 | |
| Levered FCF (₹, Millions) | ₹4.63b | ₹8.60b | ₹9.95b | ₹10.9b | ₹11.9b | ₹12.8b | ₹13.8b | ₹14.8b | ₹15.9b | ₹17.0b |
| Growth Rate Estimate Source | Analyst x7 | Analyst x7 | Analyst x6 | Est @ 9.65% | Est @ 8.77% | Est @ 8.16% | Est @ 7.73% | Est @ 7.43% | Est @ 7.22% | Est @ 7.07% |
| Present Value (₹, Millions) Discounted @ 16% | ₹4.0k | ₹6.4k | ₹6.4k | ₹6.0k | ₹5.6k | ₹5.3k | ₹4.9k | ₹4.5k | ₹4.2k | ₹3.9k |
("Est" = FCF growth rate estimated by Simply Wall St)
Present Value of 10-year Cash Flow (PVCF) = ₹51b
We now need to calculate the Terminal Value, which accounts for all the future cash flows after this ten year period. The Gordon Growth formula is used to calculate Terminal Value at a future annual growth rate equal to the 5-year average of the 10-year government bond yield of 6.7%. We discount the terminal cash flows to today's value at a cost of equity of 16%.
Terminal Value (TV)= FCF2033 × (1 + g) ÷ (r – g) = ₹17b× (1 + 6.7%) ÷ (16%– 6.7%) = ₹196b
Present Value of Terminal Value (PVTV)= TV / (1 + r)10= ₹196b÷ ( 1 + 16%)10= ₹44b
The total value, or equity value, is then the sum of the present value of the future cash flows, which in this case is ₹95b. To get the intrinsic value per share, we divide this by the total number of shares outstanding. Compared to the current share price of ₹1.4k, the company appears around fair value at the time of writing. Valuations are imprecise instruments though, rather like a telescope - move a few degrees and end up in a different galaxy. Do keep this in mind.
The Assumptions
The calculation above is very dependent on two assumptions. The first is the discount rate and the other is the cash flows. You don't have to agree with these inputs, I recommend redoing the calculations yourself and playing with them. The DCF also does not consider the possible cyclicality of an industry, or a company's future capital requirements, so it does not give a full picture of a company's potential performance. Given that we are looking at Birla as potential shareholders, the cost of equity is used as the discount rate, rather than the cost of capital (or weighted average cost of capital, WACC) which accounts for debt. In this calculation we've used 16%, which is based on a levered beta of 1.116. Beta is a measure of a stock's volatility, compared to the market as a whole. We get our beta from the industry average beta of globally comparable companies, with an imposed limit between 0.8 and 2.0, which is a reasonable range for a stable business.
SWOT Analysis for Birla
Strength
- Debt is well covered by cash flow.
- Dividends are covered by earnings and cash flows.
Weakness
- Earnings declined over the past year.
- Interest payments on debt are not well covered.
- Dividend is low compared to the top 25% of dividend payers in the Basic Materials market.
- Expensive based on P/E ratio and estimated fair value.
Opportunity
- Annual earnings are forecast to grow faster than the Indian market.
Threat
- Annual revenue is forecast to grow slower than the Indian market.
Moving On:
Valuation is only one side of the coin in terms of building your investment thesis, and it shouldn't be the only metric you look at when researching a company. DCF models are not the be-all and end-all of investment valuation. Instead the best use for a DCF model is to test certain assumptions and theories to see if they would lead to the company being undervalued or overvalued. If a company grows at a different rate, or if its cost of equity or risk free rate changes sharply, the output can look very different. For Birla, we've compiled three pertinent items you should look at:
- Risks: Be aware that Birla is showing 2 warning signs in our investment analysis , and 1 of those is significant...
- Future Earnings: How does BIRLACORPN's growth rate compare to its peers and the wider market? Dig deeper into the analyst consensus number for the upcoming years by interacting with our free analyst growth expectation chart.
- Other Solid Businesses: Low debt, high returns on equity and good past performance are fundamental to a strong business. Why not explore our interactive list of stocks with solid business fundamentals to see if there are other companies you may not have considered!
PS. Simply Wall St updates its DCF calculation for every Indian stock every day, so if you want to find the intrinsic value of any other stock just search here.
Valuation is complex, but we're here to simplify it.
Discover if Birla might be undervalued or overvalued with our detailed analysis, featuring fair value estimates, potential risks, dividends, insider trades, and its financial condition.
Access Free AnalysisHave feedback on this article? Concerned about the content? Get in touch with us directly. Alternatively, email editorial-team (at) simplywallst.com.
This article by Simply Wall St is general in nature. We provide commentary based on historical data and analyst forecasts only using an unbiased methodology and our articles are not intended to be financial advice. It does not constitute a recommendation to buy or sell any stock, and does not take account of your objectives, or your financial situation. We aim to bring you long-term focused analysis driven by fundamental data. Note that our analysis may not factor in the latest price-sensitive company announcements or qualitative material. Simply Wall St has no position in any stocks mentioned.
About NSEI:BIRLACORPN
Birla
Manufactures and sells cement and clinker in India and internationally.
Excellent balance sheet, good value and pays a dividend.
Similar Companies
Market Insights

Advertisement
Community Narratives
MINISO's fair value is projected at 26.69 with an anticipated PE ratio shift of 20x
Fair Value US$24.03|11.0% undervalued
BE
Community Contributor
Procter & Gamble: A Dividend Giant Facing Slowing Growth
Fair Value US$119.81|23.3% overvalued
AN
Community Contributor
Eli Lilly's Future Growth Driven by Tirzepatide and Favorable Market Conditions
Fair Value US$1.19k|13.8% undervalued
EA
Community Contributor