
Advertisement
Revenues Not Telling The Story For Triveni Engineering & Industries Limited (NSE:TRIVENI) After Shares Rise 26%
Triveni Engineering & Industries Limited (NSE:TRIVENI) shares have continued their recent momentum with a 26% gain in the last month alone. Looking back a bit further, it's encouraging to see the stock is up 35% in the last year.
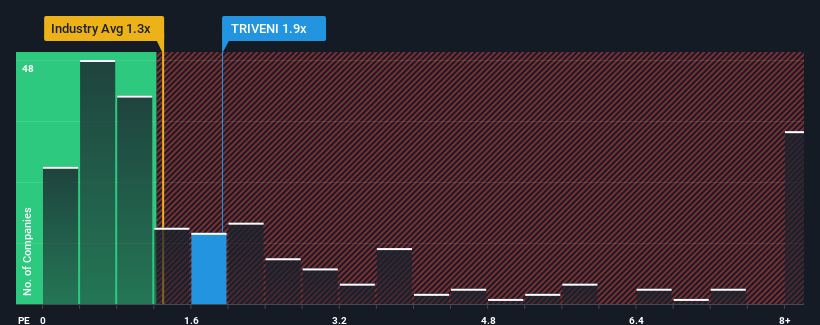
After such a large jump in price, given close to half the companies operating in India's Food industry have price-to-sales ratios (or "P/S") below 1.3x, you may consider Triveni Engineering & Industries as a stock to potentially avoid with its 1.9x P/S ratio. However, the P/S might be high for a reason and it requires further investigation to determine if it's justified.
View our latest analysis for Triveni Engineering & Industries
What Does Triveni Engineering & Industries' P/S Mean For Shareholders?
Triveni Engineering & Industries hasn't been tracking well recently as its declining revenue compares poorly to other companies, which have seen some growth in their revenues on average. Perhaps the market is expecting the poor revenue to reverse, justifying it's current high P/S.. If not, then existing shareholders may be extremely nervous about the viability of the share price.
Keen to find out how analysts think Triveni Engineering & Industries' future stacks up against the industry? In that case, our free report is a great place to start.What Are Revenue Growth Metrics Telling Us About The High P/S?
In order to justify its P/S ratio, Triveni Engineering & Industries would need to produce impressive growth in excess of the industry.
Taking a look back first, the company's revenue growth last year wasn't something to get excited about as it posted a disappointing decline of 4.8%. That put a dampener on the good run it was having over the longer-term as its three-year revenue growth is still a noteworthy 19% in total. Accordingly, while they would have preferred to keep the run going, shareholders would be roughly satisfied with the medium-term rates of revenue growth.
Turning to the outlook, the next year should generate growth of 14% as estimated by the four analysts watching the company. With the industry predicted to deliver 13% growth , the company is positioned for a comparable revenue result.
With this information, we find it interesting that Triveni Engineering & Industries is trading at a high P/S compared to the industry. Apparently many investors in the company are more bullish than analysts indicate and aren't willing to let go of their stock right now. These shareholders may be setting themselves up for disappointment if the P/S falls to levels more in line with the growth outlook.
The Bottom Line On Triveni Engineering & Industries' P/S
Triveni Engineering & Industries' P/S is on the rise since its shares have risen strongly. While the price-to-sales ratio shouldn't be the defining factor in whether you buy a stock or not, it's quite a capable barometer of revenue expectations.
Seeing as its revenues are forecast to grow in line with the wider industry, it would appear that Triveni Engineering & Industries currently trades on a higher than expected P/S. Right now we are uncomfortable with the relatively high share price as the predicted future revenues aren't likely to support such positive sentiment for long. This places shareholders' investments at risk and potential investors in danger of paying an unnecessary premium.
And what about other risks? Every company has them, and we've spotted 3 warning signs for Triveni Engineering & Industries (of which 1 is potentially serious!) you should know about.
If companies with solid past earnings growth is up your alley, you may wish to see this free collection of other companies with strong earnings growth and low P/E ratios.
Valuation is complex, but we're here to simplify it.
Discover if Triveni Engineering & Industries might be undervalued or overvalued with our detailed analysis, featuring fair value estimates, potential risks, dividends, insider trades, and its financial condition.
Access Free AnalysisHave feedback on this article? Concerned about the content? Get in touch with us directly. Alternatively, email editorial-team (at) simplywallst.com.
This article by Simply Wall St is general in nature. We provide commentary based on historical data and analyst forecasts only using an unbiased methodology and our articles are not intended to be financial advice. It does not constitute a recommendation to buy or sell any stock, and does not take account of your objectives, or your financial situation. We aim to bring you long-term focused analysis driven by fundamental data. Note that our analysis may not factor in the latest price-sensitive company announcements or qualitative material. Simply Wall St has no position in any stocks mentioned.
About NSEI:TRIVENI
Triveni Engineering & Industries
Engages in the sugar and allied businesses, and engineering businesses in India and internationally.
Adequate balance sheet with moderate growth potential.
Similar Companies
Market Insights

Advertisement
Community Narratives
The company that turned a verb into a global necessity and basically runs the modern internet, digital ads, smartphones, maps, and AI.
Fair Value US$300.00|10.8% undervalued
OS
Community Contributor
Flowers Foods Pays A Fair Price For Health
Fair Value US$16.12|22.0% undervalued
NV
Community Contributor
TMX Group will thrive with 33.3% profit margin and enduring market moat
Fair Value CA$49.90|3.8% overvalued
LI
Community Contributor