
Advertisement
Is There An Opportunity With Heritage Foods Limited's (NSE:HERITGFOOD) 42% Undervaluation?

Key Insights
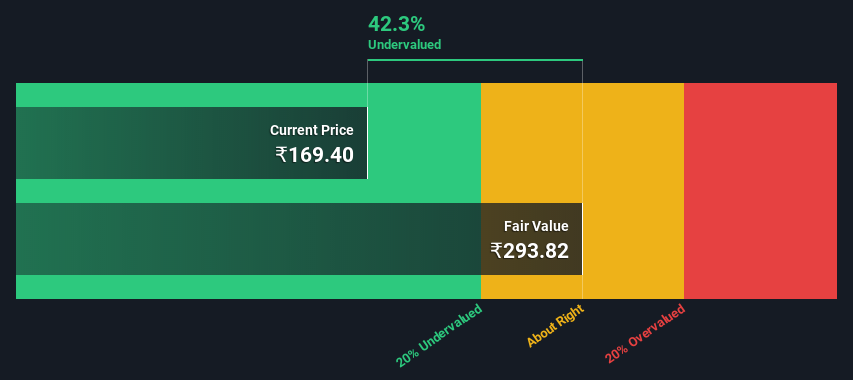
- The projected fair value for Heritage Foods is ₹294 based on 2 Stage Free Cash Flow to Equity
- Heritage Foods is estimated to be 42% undervalued based on current share price of ₹169
- The average premium for Heritage Foods' competitorsis currently 608%
Does the April share price for Heritage Foods Limited (NSE:HERITGFOOD) reflect what it's really worth? Today, we will estimate the stock's intrinsic value by estimating the company's future cash flows and discounting them to their present value. One way to achieve this is by employing the Discounted Cash Flow (DCF) model. Don't get put off by the jargon, the math behind it is actually quite straightforward.
We would caution that there are many ways of valuing a company and, like the DCF, each technique has advantages and disadvantages in certain scenarios. For those who are keen learners of equity analysis, the Simply Wall St analysis model here may be something of interest to you.
See our latest analysis for Heritage Foods
The Calculation
We use what is known as a 2-stage model, which simply means we have two different periods of growth rates for the company's cash flows. Generally the first stage is higher growth, and the second stage is a lower growth phase. In the first stage we need to estimate the cash flows to the business over the next ten years. Where possible we use analyst estimates, but when these aren't available we extrapolate the previous free cash flow (FCF) from the last estimate or reported value. We assume companies with shrinking free cash flow will slow their rate of shrinkage, and that companies with growing free cash flow will see their growth rate slow, over this period. We do this to reflect that growth tends to slow more in the early years than it does in later years.
A DCF is all about the idea that a dollar in the future is less valuable than a dollar today, and so the sum of these future cash flows is then discounted to today's value:
10-year free cash flow (FCF) estimate
| 2023 | 2024 | 2025 | 2026 | 2027 | 2028 | 2029 | 2030 | 2031 | 2032 | |
| Levered FCF (₹, Millions) | ₹1.96b | ₹1.53b | ₹1.89b | ₹2.24b | ₹2.58b | ₹2.91b | ₹3.22b | ₹3.53b | ₹3.85b | ₹4.16b |
| Growth Rate Estimate Source | Analyst x1 | Analyst x1 | Est @ 23.75% | Est @ 18.67% | Est @ 15.11% | Est @ 12.62% | Est @ 10.88% | Est @ 9.66% | Est @ 8.80% | Est @ 8.21% |
| Present Value (₹, Millions) Discounted @ 15% | ₹1.7k | ₹1.2k | ₹1.3k | ₹1.3k | ₹1.3k | ₹1.3k | ₹1.2k | ₹1.2k | ₹1.1k | ₹1.1k |
("Est" = FCF growth rate estimated by Simply Wall St)
Present Value of 10-year Cash Flow (PVCF) = ₹13b
The second stage is also known as Terminal Value, this is the business's cash flow after the first stage. The Gordon Growth formula is used to calculate Terminal Value at a future annual growth rate equal to the 5-year average of the 10-year government bond yield of 6.8%. We discount the terminal cash flows to today's value at a cost of equity of 15%.
Terminal Value (TV)= FCF2032 × (1 + g) ÷ (r – g) = ₹4.2b× (1 + 6.8%) ÷ (15%– 6.8%) = ₹57b
Present Value of Terminal Value (PVTV)= TV / (1 + r)10= ₹57b÷ ( 1 + 15%)10= ₹15b
The total value is the sum of cash flows for the next ten years plus the discounted terminal value, which results in the Total Equity Value, which in this case is ₹27b. In the final step we divide the equity value by the number of shares outstanding. Compared to the current share price of ₹169, the company appears quite good value at a 42% discount to where the stock price trades currently. The assumptions in any calculation have a big impact on the valuation, so it is better to view this as a rough estimate, not precise down to the last cent.
The Assumptions
Now the most important inputs to a discounted cash flow are the discount rate, and of course, the actual cash flows. If you don't agree with these result, have a go at the calculation yourself and play with the assumptions. The DCF also does not consider the possible cyclicality of an industry, or a company's future capital requirements, so it does not give a full picture of a company's potential performance. Given that we are looking at Heritage Foods as potential shareholders, the cost of equity is used as the discount rate, rather than the cost of capital (or weighted average cost of capital, WACC) which accounts for debt. In this calculation we've used 15%, which is based on a levered beta of 0.800. Beta is a measure of a stock's volatility, compared to the market as a whole. We get our beta from the industry average beta of globally comparable companies, with an imposed limit between 0.8 and 2.0, which is a reasonable range for a stable business.
SWOT Analysis for Heritage Foods
Strength
- Debt is not viewed as a risk.
- Dividends are covered by earnings and cash flows.
- Dividend is in the top 25% of dividend payers in the market.
Weakness
- Earnings declined over the past year.
- Shareholders have been diluted in the past year.
Opportunity
- Annual earnings are forecast to grow faster than the Indian market.
- Good value based on P/E ratio and estimated fair value.
Threat
- No apparent threats visible for HERITGFOOD.
Looking Ahead:
Whilst important, the DCF calculation shouldn't be the only metric you look at when researching a company. It's not possible to obtain a foolproof valuation with a DCF model. Instead the best use for a DCF model is to test certain assumptions and theories to see if they would lead to the company being undervalued or overvalued. For example, changes in the company's cost of equity or the risk free rate can significantly impact the valuation. Why is the intrinsic value higher than the current share price? For Heritage Foods, we've put together three pertinent items you should explore:
- Risks: For instance, we've identified 3 warning signs for Heritage Foods (2 are a bit unpleasant) you should be aware of.
- Future Earnings: How does HERITGFOOD's growth rate compare to its peers and the wider market? Dig deeper into the analyst consensus number for the upcoming years by interacting with our free analyst growth expectation chart.
- Other High Quality Alternatives: Do you like a good all-rounder? Explore our interactive list of high quality stocks to get an idea of what else is out there you may be missing!
PS. The Simply Wall St app conducts a discounted cash flow valuation for every stock on the NSEI every day. If you want to find the calculation for other stocks just search here.
Valuation is complex, but we're here to simplify it.
Discover if Heritage Foods might be undervalued or overvalued with our detailed analysis, featuring fair value estimates, potential risks, dividends, insider trades, and its financial condition.
Access Free AnalysisHave feedback on this article? Concerned about the content? Get in touch with us directly. Alternatively, email editorial-team (at) simplywallst.com.
This article by Simply Wall St is general in nature. We provide commentary based on historical data and analyst forecasts only using an unbiased methodology and our articles are not intended to be financial advice. It does not constitute a recommendation to buy or sell any stock, and does not take account of your objectives, or your financial situation. We aim to bring you long-term focused analysis driven by fundamental data. Note that our analysis may not factor in the latest price-sensitive company announcements or qualitative material. Simply Wall St has no position in any stocks mentioned.
About NSEI:HERITGFOOD
Heritage Foods
Heritage Foods Limited procures and processes milk and milk products in India.
Flawless balance sheet with solid track record and pays a dividend.
Similar Companies
Market Insights


Advertisement
Community Narratives
A case for TSXV:USA to reach USD $5.00 - $9.00 (CAD $7.30–$12.29) by 2029.
Fair Value CA$12.29|91.2% undervalued
AG
Community Contributor
DLocal's Future Growth Fueled by 35% Revenue and Profit Margin Boosts
Fair Value US$195.39|94.1% undervalued
WY
Community Contributor
Historically Cheap, but the Margin of Safety Is Still Thin
Fair Value SEK 232.58|12.7% undervalued
MA
Community Contributor