
Advertisement
- India
- /
- Oil and Gas
- /
- NSEI:GESHIP
Great Eastern Shipping (NSE:GESHIP) sheds 4.5% this week, as yearly returns fall more in line with earnings growth

For many, the main point of investing in the stock market is to achieve spectacular returns. While the best companies are hard to find, but they can generate massive returns over long periods. Don't believe it? Then look at the The Great Eastern Shipping Company Limited (NSE:GESHIP) share price. It's 449% higher than it was five years ago. This just goes to show the value creation that some businesses can achieve. It's also good to see the share price up 30% over the last quarter. This could be related to the recent financial results, released recently - you can catch up on the most recent data by reading our company report.
Since the long term performance has been good but there's been a recent pullback of 4.5%, let's check if the fundamentals match the share price.
View our latest analysis for Great Eastern Shipping
To quote Buffett, 'Ships will sail around the world but the Flat Earth Society will flourish. There will continue to be wide discrepancies between price and value in the marketplace...' One way to examine how market sentiment has changed over time is to look at the interaction between a company's share price and its earnings per share (EPS).
During five years of share price growth, Great Eastern Shipping achieved compound earnings per share (EPS) growth of 78% per year. This EPS growth is higher than the 41% average annual increase in the share price. So one could conclude that the broader market has become more cautious towards the stock. This cautious sentiment is reflected in its (fairly low) P/E ratio of 6.60.
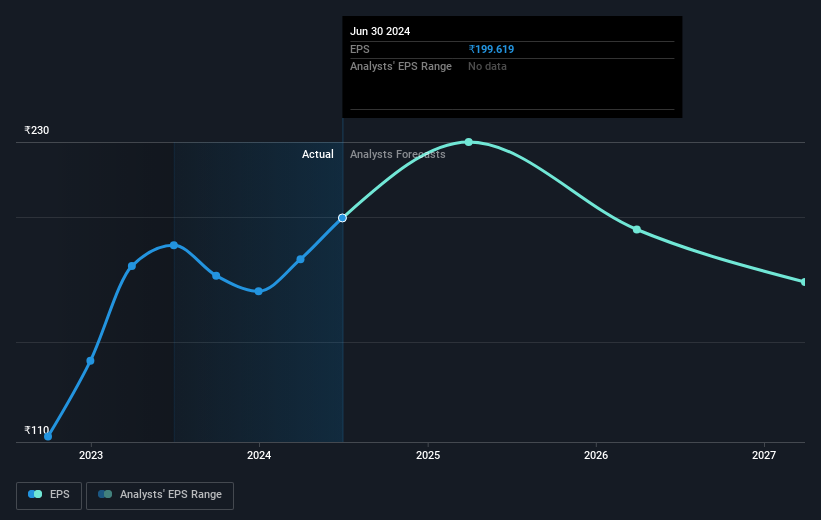
The company's earnings per share (over time) is depicted in the image below (click to see the exact numbers).
It is of course excellent to see how Great Eastern Shipping has grown profits over the years, but the future is more important for shareholders. You can see how its balance sheet has strengthened (or weakened) over time in this free interactive graphic.
What About Dividends?
When looking at investment returns, it is important to consider the difference between total shareholder return (TSR) and share price return. Whereas the share price return only reflects the change in the share price, the TSR includes the value of dividends (assuming they were reinvested) and the benefit of any discounted capital raising or spin-off. So for companies that pay a generous dividend, the TSR is often a lot higher than the share price return. We note that for Great Eastern Shipping the TSR over the last 5 years was 560%, which is better than the share price return mentioned above. The dividends paid by the company have thusly boosted the total shareholder return.
A Different Perspective
We're pleased to report that Great Eastern Shipping shareholders have received a total shareholder return of 79% over one year. That's including the dividend. Since the one-year TSR is better than the five-year TSR (the latter coming in at 46% per year), it would seem that the stock's performance has improved in recent times. Someone with an optimistic perspective could view the recent improvement in TSR as indicating that the business itself is getting better with time. I find it very interesting to look at share price over the long term as a proxy for business performance. But to truly gain insight, we need to consider other information, too. For instance, we've identified 3 warning signs for Great Eastern Shipping (1 shouldn't be ignored) that you should be aware of.
If you would prefer to check out another company -- one with potentially superior financials -- then do not miss this free list of companies that have proven they can grow earnings.
Please note, the market returns quoted in this article reflect the market weighted average returns of stocks that currently trade on Indian exchanges.
New: Manage All Your Stock Portfolios in One Place
We've created the ultimate portfolio companion for stock investors, and it's free.
• Connect an unlimited number of Portfolios and see your total in one currency
• Be alerted to new Warning Signs or Risks via email or mobile
• Track the Fair Value of your stocks
Have feedback on this article? Concerned about the content? Get in touch with us directly. Alternatively, email editorial-team (at) simplywallst.com.
This article by Simply Wall St is general in nature. We provide commentary based on historical data and analyst forecasts only using an unbiased methodology and our articles are not intended to be financial advice. It does not constitute a recommendation to buy or sell any stock, and does not take account of your objectives, or your financial situation. We aim to bring you long-term focused analysis driven by fundamental data. Note that our analysis may not factor in the latest price-sensitive company announcements or qualitative material. Simply Wall St has no position in any stocks mentioned.
About NSEI:GESHIP
Great Eastern Shipping
Through its subsidiaries, engages in the shipping and offshore businesses in India and internationally.
Flawless balance sheet, undervalued and pays a dividend.
Market Insights


Advertisement
Community Narratives
Airbnb (ABNB): Still one of the most interesting bets in travel
Fair Value US$163.75|23.9% undervalued
TI
Community Contributor
ING leads the pack when it comes to pivoting towards non-lending income
Fair Value €27.92|23.7% undervalued
PI
Community Contributor
Coles (ASX: COL): Safe, Steady, and Surprisingly Cheap
Fair Value AU$22.00|4.0% undervalued
RO
Community Contributor