
Advertisement
- India
- /
- Capital Markets
- /
- NSEI:AVONMORE
A Piece Of The Puzzle Missing From Avonmore Capital & Management Services Limited's (NSE:AVONMORE) 25% Share Price Climb
Despite an already strong run, Avonmore Capital & Management Services Limited (NSE:AVONMORE) shares have been powering on, with a gain of 25% in the last thirty days. Looking back a bit further, it's encouraging to see the stock is up 79% in the last year.
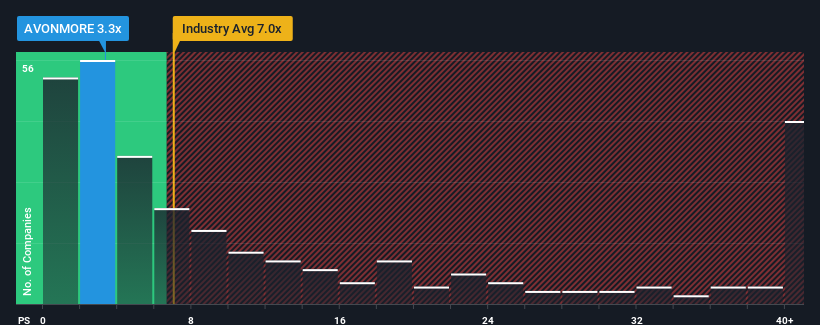
In spite of the firm bounce in price, Avonmore Capital & Management Services may still be sending very bullish signals at the moment with its price-to-sales (or "P/S") ratio of 3.3x, since almost half of all companies in the Capital Markets industry in India have P/S ratios greater than 7x and even P/S higher than 22x are not unusual. However, the P/S might be quite low for a reason and it requires further investigation to determine if it's justified.
View our latest analysis for Avonmore Capital & Management Services
What Does Avonmore Capital & Management Services' P/S Mean For Shareholders?
For instance, Avonmore Capital & Management Services' receding revenue in recent times would have to be some food for thought. One possibility is that the P/S is low because investors think the company won't do enough to avoid underperforming the broader industry in the near future. Those who are bullish on Avonmore Capital & Management Services will be hoping that this isn't the case so that they can pick up the stock at a lower valuation.
Although there are no analyst estimates available for Avonmore Capital & Management Services, take a look at this free data-rich visualisation to see how the company stacks up on earnings, revenue and cash flow.What Are Revenue Growth Metrics Telling Us About The Low P/S?
Avonmore Capital & Management Services' P/S ratio would be typical for a company that's expected to deliver very poor growth or even falling revenue, and importantly, perform much worse than the industry.
Taking a look back first, the company's revenue growth last year wasn't something to get excited about as it posted a disappointing decline of 42%. Still, the latest three year period has seen an excellent 83% overall rise in revenue, in spite of its unsatisfying short-term performance. Although it's been a bumpy ride, it's still fair to say the revenue growth recently has been more than adequate for the company.
Comparing that to the industry, which is only predicted to deliver 13% growth in the next 12 months, the company's momentum is stronger based on recent medium-term annualised revenue results.
In light of this, it's peculiar that Avonmore Capital & Management Services' P/S sits below the majority of other companies. Apparently some shareholders believe the recent performance has exceeded its limits and have been accepting significantly lower selling prices.
The Final Word
Shares in Avonmore Capital & Management Services have risen appreciably however, its P/S is still subdued. We'd say the price-to-sales ratio's power isn't primarily as a valuation instrument but rather to gauge current investor sentiment and future expectations.
We're very surprised to see Avonmore Capital & Management Services currently trading on a much lower than expected P/S since its recent three-year growth is higher than the wider industry forecast. When we see strong revenue with faster-than-industry growth, we assume there are some significant underlying risks to the company's ability to make money which is applying downwards pressure on the P/S ratio. While recent revenue trends over the past medium-term suggest that the risk of a price decline is low, investors appear to perceive a likelihood of revenue fluctuations in the future.
Before you settle on your opinion, we've discovered 2 warning signs for Avonmore Capital & Management Services that you should be aware of.
If these risks are making you reconsider your opinion on Avonmore Capital & Management Services, explore our interactive list of high quality stocks to get an idea of what else is out there.
New: Manage All Your Stock Portfolios in One Place
We've created the ultimate portfolio companion for stock investors, and it's free.
• Connect an unlimited number of Portfolios and see your total in one currency
• Be alerted to new Warning Signs or Risks via email or mobile
• Track the Fair Value of your stocks
Have feedback on this article? Concerned about the content? Get in touch with us directly. Alternatively, email editorial-team (at) simplywallst.com.
This article by Simply Wall St is general in nature. We provide commentary based on historical data and analyst forecasts only using an unbiased methodology and our articles are not intended to be financial advice. It does not constitute a recommendation to buy or sell any stock, and does not take account of your objectives, or your financial situation. We aim to bring you long-term focused analysis driven by fundamental data. Note that our analysis may not factor in the latest price-sensitive company announcements or qualitative material. Simply Wall St has no position in any stocks mentioned.
Have feedback on this article? Concerned about the content? Get in touch with us directly. Alternatively, email editorial-team@simplywallst.com
About NSEI:AVONMORE
Avonmore Capital & Management Services
Provides non-banking financial and sub-broker advisory services in India.
Proven track record with adequate balance sheet.
Market Insights

Advertisement
Community Narratives
MINISO's fair value is projected at 26.69 with an anticipated PE ratio shift of 20x
Fair Value US$24.03|11.0% undervalued
BE
Community Contributor
Procter & Gamble: A Dividend Giant Facing Slowing Growth
Fair Value US$119.81|23.3% overvalued
AN
Community Contributor
Eli Lilly's Future Growth Driven by Tirzepatide and Favorable Market Conditions
Fair Value US$1.19k|13.8% undervalued
EA
Community Contributor