
Advertisement
- India
- /
- Consumer Services
- /
- NSEI:ZEELEARN
Returns On Capital Signal Difficult Times Ahead For Zee Learn (NSE:ZEELEARN)
To avoid investing in a business that's in decline, there's a few financial metrics that can provide early indications of aging. When we see a declining return on capital employed (ROCE) in conjunction with a declining base of capital employed, that's often how a mature business shows signs of aging. This indicates to us that the business is not only shrinking the size of its net assets, but its returns are falling as well. In light of that, from a first glance at Zee Learn (NSE:ZEELEARN), we've spotted some signs that it could be struggling, so let's investigate.
Understanding Return On Capital Employed (ROCE)
Just to clarify if you're unsure, ROCE is a metric for evaluating how much pre-tax income (in percentage terms) a company earns on the capital invested in its business. To calculate this metric for Zee Learn, this is the formula:
Return on Capital Employed = Earnings Before Interest and Tax (EBIT) ÷ (Total Assets - Current Liabilities)
0.0069 = ₹39m ÷ (₹10b - ₹4.5b) (Based on the trailing twelve months to September 2023).
So, Zee Learn has an ROCE of 0.7%. Ultimately, that's a low return and it under-performs the Consumer Services industry average of 13%.
See our latest analysis for Zee Learn
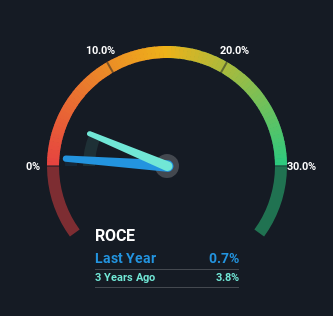
Historical performance is a great place to start when researching a stock so above you can see the gauge for Zee Learn's ROCE against it's prior returns. If you'd like to look at how Zee Learn has performed in the past in other metrics, you can view this free graph of past earnings, revenue and cash flow.
How Are Returns Trending?
The trend of ROCE at Zee Learn is showing some signs of weakness. To be more specific, today's ROCE was 9.9% five years ago but has since fallen to 0.7%. What's equally concerning is that the amount of capital deployed in the business has shrunk by 50% over that same period. The combination of lower ROCE and less capital employed can indicate that a business is likely to be facing some competitive headwinds or seeing an erosion to its moat. If these underlying trends continue, we wouldn't be too optimistic going forward.
While on the subject, we noticed that the ratio of current liabilities to total assets has risen to 45%, which has impacted the ROCE. Without this increase, it's likely that ROCE would be even lower than 0.7%. And with current liabilities at these levels, suppliers or short-term creditors are effectively funding a large part of the business, which can introduce some risks.
In Conclusion...
In short, lower returns and decreasing amounts capital employed in the business doesn't fill us with confidence. Investors haven't taken kindly to these developments, since the stock has declined 70% from where it was five years ago. Unless there is a shift to a more positive trajectory in these metrics, we would look elsewhere.
If you want to know some of the risks facing Zee Learn we've found 2 warning signs (1 is significant!) that you should be aware of before investing here.
If you want to search for solid companies with great earnings, check out this free list of companies with good balance sheets and impressive returns on equity.
Valuation is complex, but we're here to simplify it.
Discover if Zee Learn might be undervalued or overvalued with our detailed analysis, featuring fair value estimates, potential risks, dividends, insider trades, and its financial condition.
Access Free AnalysisHave feedback on this article? Concerned about the content? Get in touch with us directly. Alternatively, email editorial-team (at) simplywallst.com.
This article by Simply Wall St is general in nature. We provide commentary based on historical data and analyst forecasts only using an unbiased methodology and our articles are not intended to be financial advice. It does not constitute a recommendation to buy or sell any stock, and does not take account of your objectives, or your financial situation. We aim to bring you long-term focused analysis driven by fundamental data. Note that our analysis may not factor in the latest price-sensitive company announcements or qualitative material. Simply Wall St has no position in any stocks mentioned.
About NSEI:ZEELEARN
Slight risk and fair value.
Similar Companies
Market Insights

Advertisement
Community Narratives
MicroVision will explode future revenue by 380.37% with a vision towards success
Fair Value US$60|98.4% undervalued
TH
Community Contributor
The Indispensable Artery for a New North American Economy
Fair Value CA$132.87|1.6% undervalued
TI
Community Contributor
Recently Updated Narratives
BE


Bejgal on MINISO Group Holding ·
MINISO's fair value is projected at 26.69 with an anticipated PE ratio shift of 20x
Fair Value:US$26.6928.0% undervalued
44 followersusers have followed this narrative
3 commentsusers have commented on this narrative
0 likesusers have liked this narrative
TI


TickerTickle on Oracle ·
The Quiet Giant That Became AI’s Power Grid
Fair Value:US$389.8149.5% undervalued
7 followersusers have followed this narrative
1 commentusers have commented on this narrative
0 likesusers have liked this narrative
AU

AuCA on Nova Ljubljanska Banka d.d ·
Nova Ljubljanska Banka d.d will expect a 11.2% revenue boost driving future growth
Fair Value:€20916.3% undervalued
23 followersusers have followed this narrative
3 commentsusers have commented on this narrative
0 likesusers have liked this narrative
Popular Narratives
OS


oscargarcia on Alphabet ·
The company that turned a verb into a global necessity and basically runs the modern internet, digital ads, smartphones, maps, and AI.
Fair Value:US$3404.9% undervalued
134 followersusers have followed this narrative
6 commentsusers have commented on this narrative
18 likesusers have liked this narrative
TH

TheWallstreetKing on MicroVision ·
MicroVision will explode future revenue by 380.37% with a vision towards success
Fair Value:US$6098.4% undervalued
83 followersusers have followed this narrative
11 commentsusers have commented on this narrative
18 likesusers have liked this narrative
AN


AnalystConsensusTarget on NVIDIA ·
NVDA: Expanding AI Demand Will Drive Major Data Center Investments Through 2026
Fair Value:US$232.7923.6% undervalued
923 followersusers have followed this narrative
5 commentsusers have commented on this narrative
22 likesusers have liked this narrative