
Advertisement
Howard Marks put it nicely when he said that, rather than worrying about share price volatility, 'The possibility of permanent loss is the risk I worry about... and every practical investor I know worries about.' It's only natural to consider a company's balance sheet when you examine how risky it is, since debt is often involved when a business collapses. We note that Titan Company Limited (NSE:TITAN) does have debt on its balance sheet. But the real question is whether this debt is making the company risky.
When Is Debt A Problem?
Debt assists a business until the business has trouble paying it off, either with new capital or with free cash flow. Part and parcel of capitalism is the process of 'creative destruction' where failed businesses are mercilessly liquidated by their bankers. However, a more usual (but still expensive) situation is where a company must dilute shareholders at a cheap share price simply to get debt under control. Having said that, the most common situation is where a company manages its debt reasonably well - and to its own advantage. When we examine debt levels, we first consider both cash and debt levels, together.
What Is Titan's Debt?
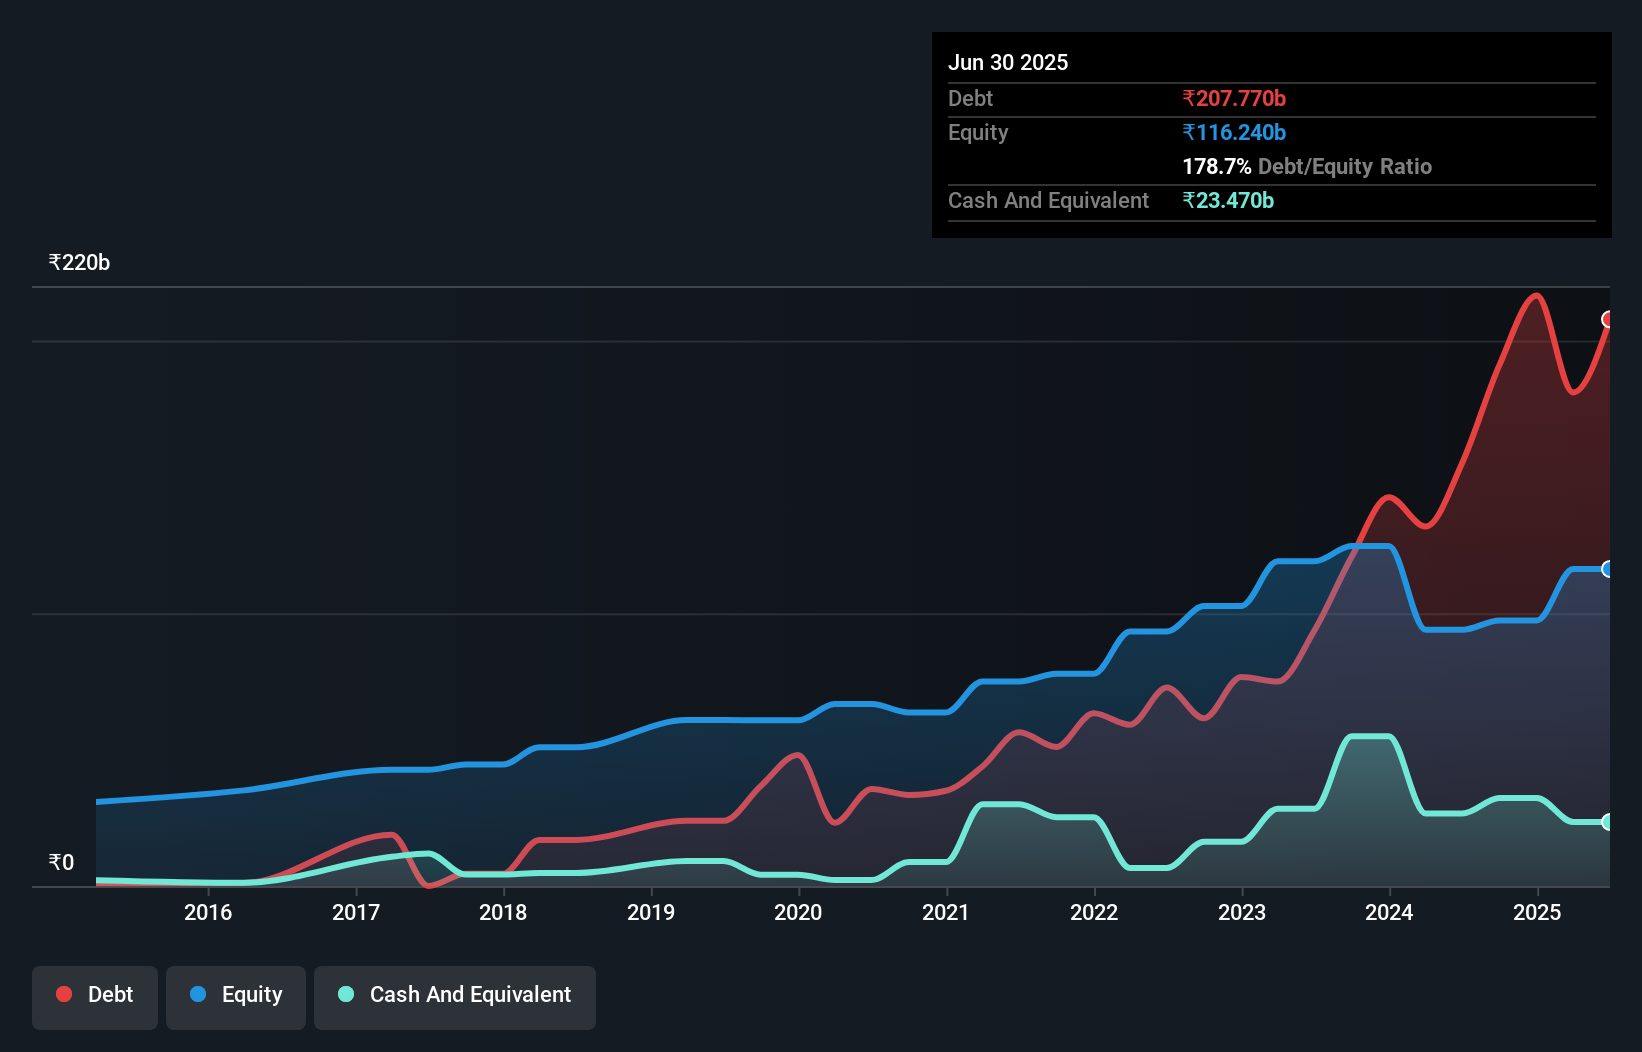
You can click the graphic below for the historical numbers, but it shows that as of March 2025 Titan had ₹207.8b of debt, an increase on ₹155.3b, over one year. However, it also had ₹23.5b in cash, and so its net debt is ₹184.3b.
A Look At Titan's Liabilities
According to the last reported balance sheet, Titan had liabilities of ₹257.9b due within 12 months, and liabilities of ₹32.3b due beyond 12 months. On the other hand, it had cash of ₹23.5b and ₹13.2b worth of receivables due within a year. So it has liabilities totalling ₹253.6b more than its cash and near-term receivables, combined.
Given Titan has a humongous market capitalization of ₹3.07t, it's hard to believe these liabilities pose much threat. Having said that, it's clear that we should continue to monitor its balance sheet, lest it change for the worse.
View our latest analysis for Titan
We use two main ratios to inform us about debt levels relative to earnings. The first is net debt divided by earnings before interest, tax, depreciation, and amortization (EBITDA), while the second is how many times its earnings before interest and tax (EBIT) covers its interest expense (or its interest cover, for short). This way, we consider both the absolute quantum of the debt, as well as the interest rates paid on it.
With net debt to EBITDA of 3.1 Titan has a fairly noticeable amount of debt. But the high interest coverage of 8.0 suggests it can easily service that debt. If Titan can keep growing EBIT at last year's rate of 16% over the last year, then it will find its debt load easier to manage. When analysing debt levels, the balance sheet is the obvious place to start. But ultimately the future profitability of the business will decide if Titan can strengthen its balance sheet over time. So if you want to see what the professionals think, you might find this free report on analyst profit forecasts to be interesting.
But our final consideration is also important, because a company cannot pay debt with paper profits; it needs cold hard cash. So it's worth checking how much of that EBIT is backed by free cash flow. In the last three years, Titan created free cash flow amounting to 7.9% of its EBIT, an uninspiring performance. That limp level of cash conversion undermines its ability to manage and pay down debt.
Our View
Titan's conversion of EBIT to free cash flow was a real negative on this analysis, although the other factors we considered were considerably better. In particular, we thought its EBIT growth rate was a positive. Considering this range of data points, we think Titan is in a good position to manage its debt levels. Having said that, the load is sufficiently heavy that we would recommend any shareholders keep a close eye on it. When analysing debt levels, the balance sheet is the obvious place to start. However, not all investment risk resides within the balance sheet - far from it. We've identified 2 warning signs with Titan (at least 1 which is concerning) , and understanding them should be part of your investment process.
If, after all that, you're more interested in a fast growing company with a rock-solid balance sheet, then check out our list of net cash growth stocks without delay.
Valuation is complex, but we're here to simplify it.
Discover if Titan might be undervalued or overvalued with our detailed analysis, featuring fair value estimates, potential risks, dividends, insider trades, and its financial condition.
Access Free AnalysisHave feedback on this article? Concerned about the content? Get in touch with us directly. Alternatively, email editorial-team (at) simplywallst.com.
This article by Simply Wall St is general in nature. We provide commentary based on historical data and analyst forecasts only using an unbiased methodology and our articles are not intended to be financial advice. It does not constitute a recommendation to buy or sell any stock, and does not take account of your objectives, or your financial situation. We aim to bring you long-term focused analysis driven by fundamental data. Note that our analysis may not factor in the latest price-sensitive company announcements or qualitative material. Simply Wall St has no position in any stocks mentioned.
About NSEI:TITAN
Titan
Manufactures and sells watches, jewelry, eyewear, and other accessories and products in India and internationally.
High growth potential with solid track record.
Similar Companies
Market Insights

Advertisement
Community Narratives
MINISO's fair value is projected at 26.69 with an anticipated PE ratio shift of 20x
Fair Value US$24.03|11.0% undervalued
BE
Community Contributor
Procter & Gamble: A Dividend Giant Facing Slowing Growth
Fair Value US$119.81|23.3% overvalued
AN
Community Contributor
Eli Lilly's Future Growth Driven by Tirzepatide and Favorable Market Conditions
Fair Value US$1.19k|13.8% undervalued
EA
Community Contributor