
David Iben put it well when he said, 'Volatility is not a risk we care about. What we care about is avoiding the permanent loss of capital.' So it seems the smart money knows that debt - which is usually involved in bankruptcies - is a very important factor, when you assess how risky a company is. We can see that Swan Corp Limited (NSE:SWANCORP) does use debt in its business. But the more important question is: how much risk is that debt creating?
When Is Debt A Problem?
Generally speaking, debt only becomes a real problem when a company can't easily pay it off, either by raising capital or with its own cash flow. If things get really bad, the lenders can take control of the business. However, a more frequent (but still costly) occurrence is where a company must issue shares at bargain-basement prices, permanently diluting shareholders, just to shore up its balance sheet. Of course, debt can be an important tool in businesses, particularly capital heavy businesses. The first thing to do when considering how much debt a business uses is to look at its cash and debt together.
What Is Swan's Net Debt?
You can click the graphic below for the historical numbers, but it shows that Swan had ₹29.7b of debt in March 2025, down from ₹34.4b, one year before. However, it does have ₹22.4b in cash offsetting this, leading to net debt of about ₹7.30b.
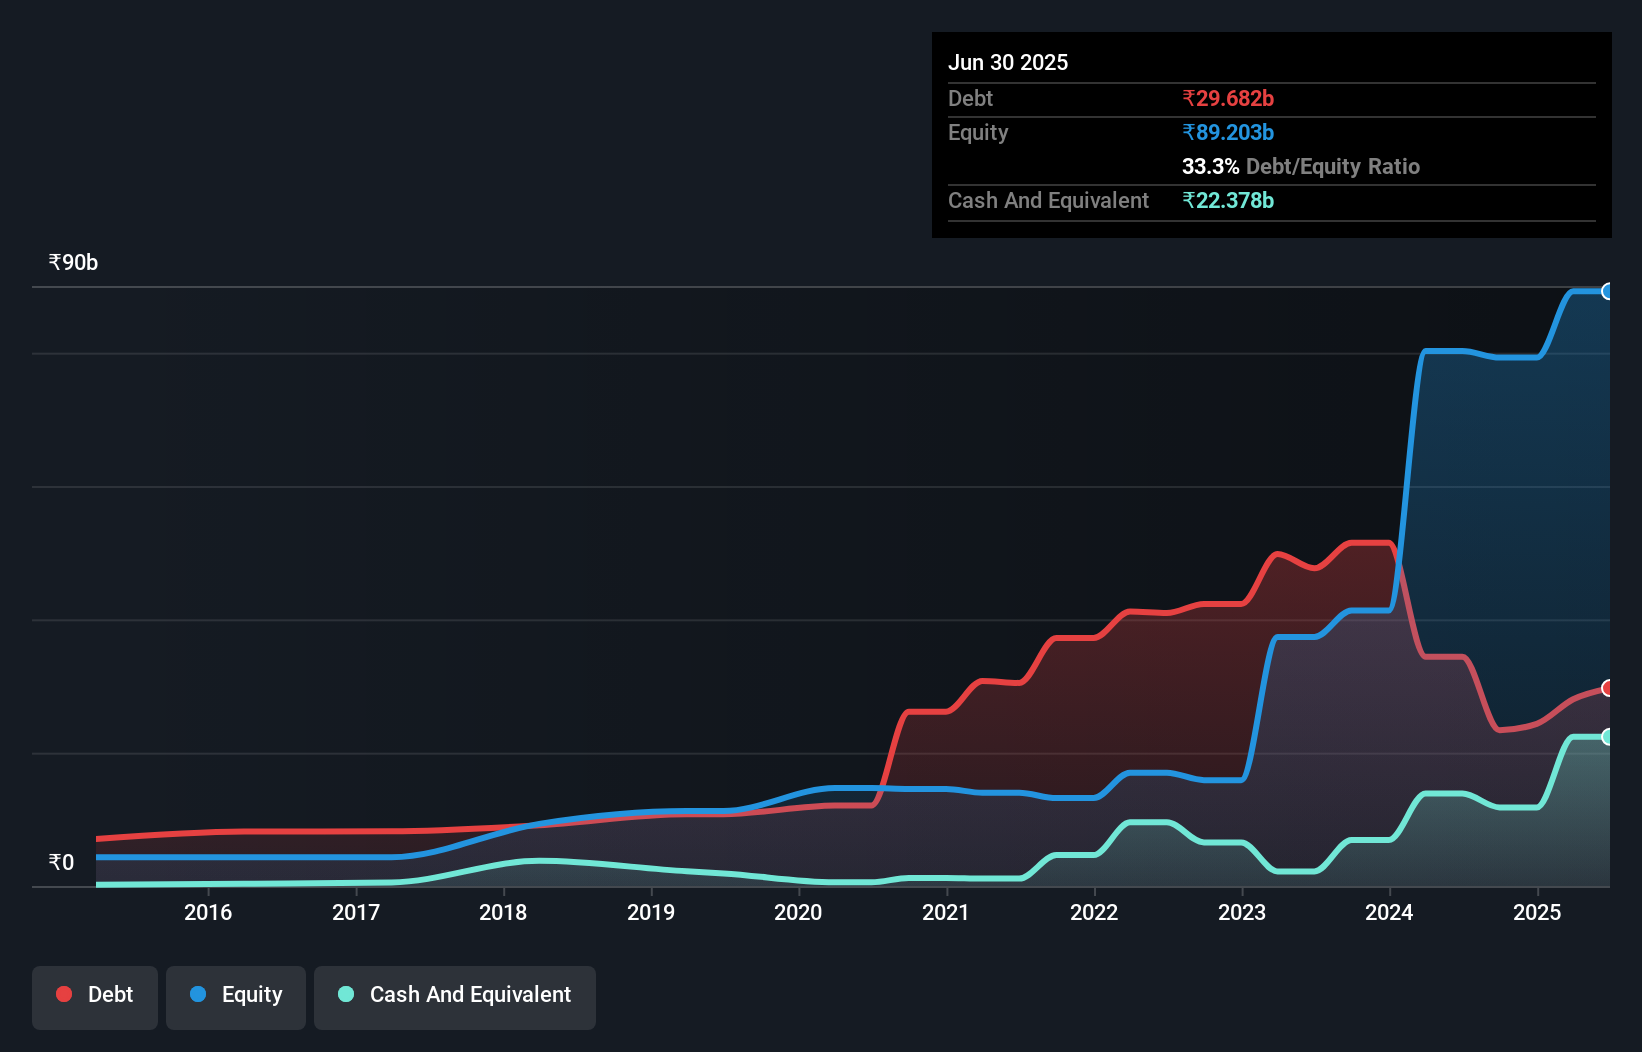
How Healthy Is Swan's Balance Sheet?
We can see from the most recent balance sheet that Swan had liabilities of ₹27.0b falling due within a year, and liabilities of ₹19.8b due beyond that. On the other hand, it had cash of ₹22.4b and ₹18.1b worth of receivables due within a year. So its liabilities outweigh the sum of its cash and (near-term) receivables by ₹6.34b.
Of course, Swan has a market capitalization of ₹148.2b, so these liabilities are probably manageable. Having said that, it's clear that we should continue to monitor its balance sheet, lest it change for the worse. There's no doubt that we learn most about debt from the balance sheet. But it is Swan's earnings that will influence how the balance sheet holds up in the future. So if you're keen to discover more about its earnings, it might be worth checking out this graph of its long term earnings trend.
Check out our latest analysis for Swan
Over 12 months, Swan made a loss at the EBIT level, and saw its revenue drop to ₹50b, which is a fall of 6.4%. We would much prefer see growth.
Caveat Emptor
Importantly, Swan had an earnings before interest and tax (EBIT) loss over the last year. To be specific the EBIT loss came in at ₹6.5b. When we look at that and recall the liabilities on its balance sheet, relative to cash, it seems unwise to us for the company to have any debt. Quite frankly we think the balance sheet is far from match-fit, although it could be improved with time. Another cause for caution is that is bled ₹19b in negative free cash flow over the last twelve months. So in short it's a really risky stock. For riskier companies like Swan I always like to keep an eye on the long term profit and revenue trends. Fortunately, you can click to see our interactive graph of its profit, revenue, and operating cashflow.
When all is said and done, sometimes its easier to focus on companies that don't even need debt. Readers can access a list of growth stocks with zero net debt 100% free, right now.
The New Payments ETF Is Live on NASDAQ:
Money is moving to real-time rails, and a newly listed ETF now gives investors direct exposure. Fast settlement. Institutional custody. Simple access.
Explore how this launch could reshape portfolios
Sponsored ContentNew: Manage All Your Stock Portfolios in One Place
We've created the ultimate portfolio companion for stock investors, and it's free.
• Connect an unlimited number of Portfolios and see your total in one currency
• Be alerted to new Warning Signs or Risks via email or mobile
• Track the Fair Value of your stocks
Have feedback on this article? Concerned about the content? Get in touch with us directly. Alternatively, email editorial-team (at) simplywallst.com.
This article by Simply Wall St is general in nature. We provide commentary based on historical data and analyst forecasts only using an unbiased methodology and our articles are not intended to be financial advice. It does not constitute a recommendation to buy or sell any stock, and does not take account of your objectives, or your financial situation. We aim to bring you long-term focused analysis driven by fundamental data. Note that our analysis may not factor in the latest price-sensitive company announcements or qualitative material. Simply Wall St has no position in any stocks mentioned.
About NSEI:SWANCORP
Swan
Manufactures and markets cotton, polyester cotton, linen and viscose fabrics, and non-lycra products in India and internationally.
Proven track record with adequate balance sheet.
Market Insights

Weekly Picks

THE KINGDOM OF BROWN GOODS: WHY MGPI IS BEING CRUSHED BY INVENTORY & PRIMED FOR RESURRECTION


Why Vertical Aerospace (NYSE: EVTL) is Worth Possibly Over 13x its Current Price


The Quiet Giant That Became AI’s Power Grid
Recently Updated Narratives


A case for USD $14.81 per share based on book value. Be warned, this is a micro-cap dependent on a single mine.

Occidental Petroleum to Become Fairly Priced at $68.29 According to Future Projections

Agfa-Gevaert is a digital and materials turnaround opportunity, with growth potential in ZIRFON, but carrying legacy risks.
Popular Narratives


MicroVision will explode future revenue by 380.37% with a vision towards success


Crazy Undervalued 42 Baggers Silver Play (Active & Running Mine)


