
Advertisement
Superhouse (NSE:SUPERHOUSE) Might Be Having Difficulty Using Its Capital Effectively
Finding a business that has the potential to grow substantially is not easy, but it is possible if we look at a few key financial metrics. In a perfect world, we'd like to see a company investing more capital into its business and ideally the returns earned from that capital are also increasing. This shows us that it's a compounding machine, able to continually reinvest its earnings back into the business and generate higher returns. Having said that, from a first glance at Superhouse (NSE:SUPERHOUSE) we aren't jumping out of our chairs at how returns are trending, but let's have a deeper look.
Understanding Return On Capital Employed (ROCE)
For those who don't know, ROCE is a measure of a company's yearly pre-tax profit (its return), relative to the capital employed in the business. Analysts use this formula to calculate it for Superhouse:
Return on Capital Employed = Earnings Before Interest and Tax (EBIT) ÷ (Total Assets - Current Liabilities)
0.096 = ₹391m ÷ (₹6.8b - ₹2.7b) (Based on the trailing twelve months to December 2020).
Thus, Superhouse has an ROCE of 9.6%. Even though it's in line with the industry average of 9.6%, it's still a low return by itself.
View our latest analysis for Superhouse
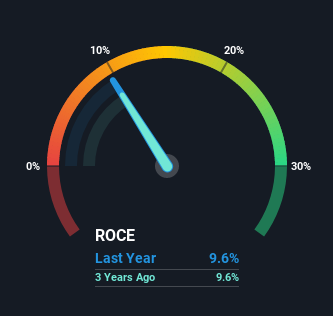
Historical performance is a great place to start when researching a stock so above you can see the gauge for Superhouse's ROCE against it's prior returns. If you're interested in investigating Superhouse's past further, check out this free graph of past earnings, revenue and cash flow.
What Does the ROCE Trend For Superhouse Tell Us?
On the surface, the trend of ROCE at Superhouse doesn't inspire confidence. Around five years ago the returns on capital were 20%, but since then they've fallen to 9.6%. And considering revenue has dropped while employing more capital, we'd be cautious. If this were to continue, you might be looking at a company that is trying to reinvest for growth but is actually losing market share since sales haven't increased.
On a related note, Superhouse has decreased its current liabilities to 40% of total assets. So we could link some of this to the decrease in ROCE. What's more, this can reduce some aspects of risk to the business because now the company's suppliers or short-term creditors are funding less of its operations. Since the business is basically funding more of its operations with it's own money, you could argue this has made the business less efficient at generating ROCE. Keep in mind 40% is still pretty high, so those risks are still somewhat prevalent.
The Key Takeaway
From the above analysis, we find it rather worrisome that returns on capital and sales for Superhouse have fallen, meanwhile the business is employing more capital than it was five years ago. It should come as no surprise then that the stock has fallen 19% over the last five years, so it looks like investors are recognizing these changes. With underlying trends that aren't great in these areas, we'd consider looking elsewhere.
On a separate note, we've found 2 warning signs for Superhouse you'll probably want to know about.
For those who like to invest in solid companies, check out this free list of companies with solid balance sheets and high returns on equity.
When trading Superhouse or any other investment, use the platform considered by many to be the Professional's Gateway to the Worlds Market, Interactive Brokers. You get the lowest-cost* trading on stocks, options, futures, forex, bonds and funds worldwide from a single integrated account. Promoted
New: Manage All Your Stock Portfolios in One Place
We've created the ultimate portfolio companion for stock investors, and it's free.
• Connect an unlimited number of Portfolios and see your total in one currency
• Be alerted to new Warning Signs or Risks via email or mobile
• Track the Fair Value of your stocks
This article by Simply Wall St is general in nature. It does not constitute a recommendation to buy or sell any stock, and does not take account of your objectives, or your financial situation. We aim to bring you long-term focused analysis driven by fundamental data. Note that our analysis may not factor in the latest price-sensitive company announcements or qualitative material. Simply Wall St has no position in any stocks mentioned.
*Interactive Brokers Rated Lowest Cost Broker by StockBrokers.com Annual Online Review 2020
Have feedback on this article? Concerned about the content? Get in touch with us directly. Alternatively, email editorial-team (at) simplywallst.com.
About NSEI:SUPERHOUSE
Superhouse
Engages in the manufacture and sale of leather and leather products, as well as textile garments in India and internationally.
Moderate risk with adequate balance sheet.
Market Insights

Advertisement
Community Narratives
MINISO's fair value is projected at 26.69 with an anticipated PE ratio shift of 20x
Fair Value US$24.03|11.0% undervalued
BE
Community Contributor
Procter & Gamble: A Dividend Giant Facing Slowing Growth
Fair Value US$119.81|23.3% overvalued
AN
Community Contributor
Eli Lilly's Future Growth Driven by Tirzepatide and Favorable Market Conditions
Fair Value US$1.19k|13.8% undervalued
EA
Community Contributor