
Advertisement
CEO Sundararajan Mudaliar, S.P. Apparels Limited's (NSE:SPAL) largest shareholder sees value of holdings go down 10% after recent drop
Key Insights
- Significant insider control over S.P. Apparels implies vested interests in company growth
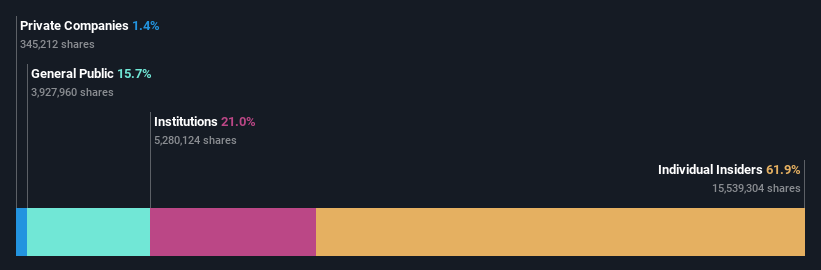
- 62% of the business is held by the top 2 shareholders
- Institutions own 21% of S.P. Apparels
To get a sense of who is truly in control of S.P. Apparels Limited (NSE:SPAL), it is important to understand the ownership structure of the business. We can see that individual insiders own the lion's share in the company with 62% ownership. Put another way, the group faces the maximum upside potential (or downside risk).
And last week, insiders endured the biggest losses as the stock fell by 10%.
Let's take a closer look to see what the different types of shareholders can tell us about S.P. Apparels.
View our latest analysis for S.P. Apparels
What Does The Institutional Ownership Tell Us About S.P. Apparels?
Institutional investors commonly compare their own returns to the returns of a commonly followed index. So they generally do consider buying larger companies that are included in the relevant benchmark index.
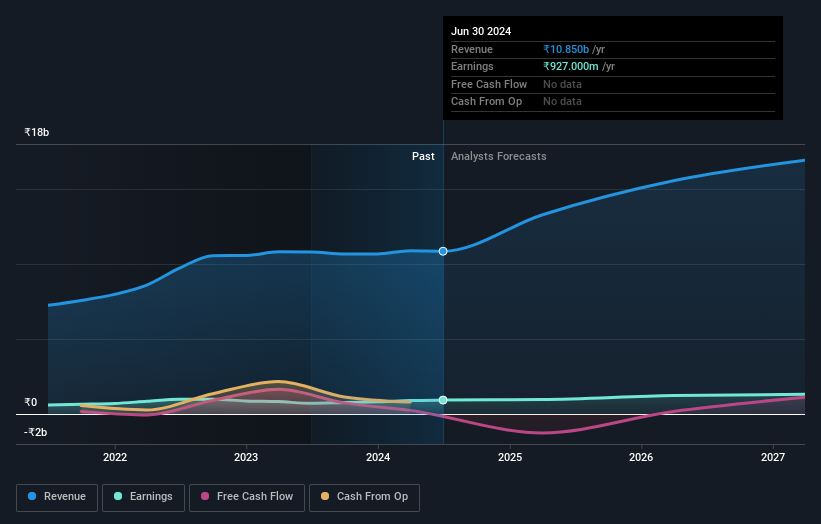
As you can see, institutional investors have a fair amount of stake in S.P. Apparels. This implies the analysts working for those institutions have looked at the stock and they like it. But just like anyone else, they could be wrong. It is not uncommon to see a big share price drop if two large institutional investors try to sell out of a stock at the same time. So it is worth checking the past earnings trajectory of S.P. Apparels, (below). Of course, keep in mind that there are other factors to consider, too.
Hedge funds don't have many shares in S.P. Apparels. With a 50% stake, CEO Sundararajan Mudaliar is the largest shareholder. Sundararajan Latha is the second largest shareholder owning 12% of common stock, and DSP BlackRock Investment Managers Pvt. Ltd. holds about 8.7% of the company stock. Interestingly, the second-largest shareholder, Sundararajan Latha is also Senior Key Executive, again, pointing towards strong insider ownership amongst the company's top shareholders.
To make our study more interesting, we found that the top 2 shareholders have a majority ownership in the company, meaning that they are powerful enough to influence the decisions of the company.
While it makes sense to study institutional ownership data for a company, it also makes sense to study analyst sentiments to know which way the wind is blowing. There are a reasonable number of analysts covering the stock, so it might be useful to find out their aggregate view on the future.
Insider Ownership Of S.P. Apparels
The definition of company insiders can be subjective and does vary between jurisdictions. Our data reflects individual insiders, capturing board members at the very least. Company management run the business, but the CEO will answer to the board, even if he or she is a member of it.
Most consider insider ownership a positive because it can indicate the board is well aligned with other shareholders. However, on some occasions too much power is concentrated within this group.
Our information suggests that insiders own more than half of S.P. Apparels Limited. This gives them effective control of the company. Given it has a market cap of ₹22b, that means they have ₹14b worth of shares. It is good to see this level of investment. You can check here to see if those insiders have been buying recently.
General Public Ownership
With a 16% ownership, the general public, mostly comprising of individual investors, have some degree of sway over S.P. Apparels. This size of ownership, while considerable, may not be enough to change company policy if the decision is not in sync with other large shareholders.
Next Steps:
It's always worth thinking about the different groups who own shares in a company. But to understand S.P. Apparels better, we need to consider many other factors. Take risks for example - S.P. Apparels has 1 warning sign we think you should be aware of.
Ultimately the future is most important. You can access this free report on analyst forecasts for the company.
NB: Figures in this article are calculated using data from the last twelve months, which refer to the 12-month period ending on the last date of the month the financial statement is dated. This may not be consistent with full year annual report figures.
New: Manage All Your Stock Portfolios in One Place
We've created the ultimate portfolio companion for stock investors, and it's free.
• Connect an unlimited number of Portfolios and see your total in one currency
• Be alerted to new Warning Signs or Risks via email or mobile
• Track the Fair Value of your stocks
Have feedback on this article? Concerned about the content? Get in touch with us directly. Alternatively, email editorial-team (at) simplywallst.com.
This article by Simply Wall St is general in nature. We provide commentary based on historical data and analyst forecasts only using an unbiased methodology and our articles are not intended to be financial advice. It does not constitute a recommendation to buy or sell any stock, and does not take account of your objectives, or your financial situation. We aim to bring you long-term focused analysis driven by fundamental data. Note that our analysis may not factor in the latest price-sensitive company announcements or qualitative material. Simply Wall St has no position in any stocks mentioned.
About NSEI:SPAL
S.P. Apparels
Manufactures and exports knitted garments for infants and children in India and internationally.
Fair value with mediocre balance sheet.
Similar Companies
Market Insights

Advertisement
Community Narratives
Finding The True Value Of A Logistics Powerhouse
Fair Value US$95.21|8.4% undervalued
NV
Community Contributor
Paradigm Biopharmaceuticals Will Lead Osteoarthritis Treatment with Zilosul's FDA Success
Fair Value AU$5.50|92.1% undervalued
AM
Community Contributor
Barrick Mining (ABX:CA): A Gold Hedge against a U.S. Shutdown
Fair Value CA$60.00|24.2% undervalued
GM
Community Contributor