
Advertisement
Sanathan Textiles Limited (NSE:SANATHAN) Stock Is Going Strong But Fundamentals Look Uncertain: What Lies Ahead ?

Sanathan Textiles' (NSE:SANATHAN) stock is up by a considerable 31% over the past three months. However, we wonder if the company's inconsistent financials would have any adverse impact on the current share price momentum. Specifically, we decided to study Sanathan Textiles' ROE in this article.
Return on equity or ROE is an important factor to be considered by a shareholder because it tells them how effectively their capital is being reinvested. In other words, it is a profitability ratio which measures the rate of return on the capital provided by the company's shareholders.
How Is ROE Calculated?
Return on equity can be calculated by using the formula:
Return on Equity = Net Profit (from continuing operations) ÷ Shareholders' Equity
So, based on the above formula, the ROE for Sanathan Textiles is:
8.9% = ₹1.6b ÷ ₹18b (Based on the trailing twelve months to March 2025).
The 'return' is the yearly profit. That means that for every ₹1 worth of shareholders' equity, the company generated ₹0.09 in profit.
View our latest analysis for Sanathan Textiles
What Is The Relationship Between ROE And Earnings Growth?
Thus far, we have learned that ROE measures how efficiently a company is generating its profits. We now need to evaluate how much profit the company reinvests or "retains" for future growth which then gives us an idea about the growth potential of the company. Generally speaking, other things being equal, firms with a high return on equity and profit retention, have a higher growth rate than firms that don’t share these attributes.
A Side By Side comparison of Sanathan Textiles' Earnings Growth And 8.9% ROE
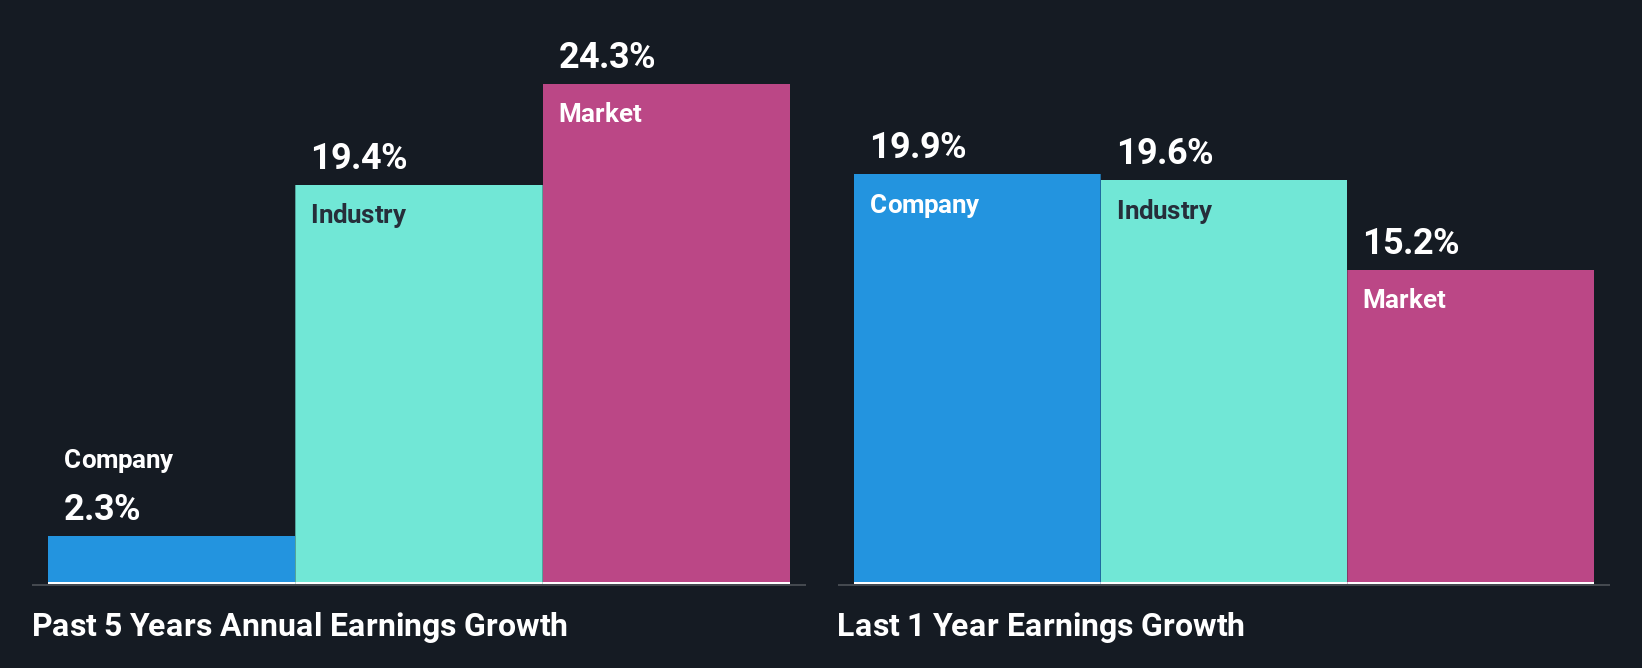
On the face of it, Sanathan Textiles' ROE is not much to talk about. However, its ROE is similar to the industry average of 7.7%, so we won't completely dismiss the company. On the other hand, Sanathan Textiles reported a fairly low 2.3% net income growth over the past five years. Remember, the company's ROE is not particularly great to begin with. So this could also be one of the reasons behind the company's low growth in earnings.
As a next step, we compared Sanathan Textiles' net income growth with the industry and were disappointed to see that the company's growth is lower than the industry average growth of 19% in the same period.
Earnings growth is a huge factor in stock valuation. It’s important for an investor to know whether the market has priced in the company's expected earnings growth (or decline). By doing so, they will have an idea if the stock is headed into clear blue waters or if swampy waters await. Has the market priced in the future outlook for SANATHAN? You can find out in our latest intrinsic value infographic research report
Is Sanathan Textiles Efficiently Re-investing Its Profits?
Sanathan Textiles doesn't pay any regular dividends, which means that it is retaining all of its earnings. However, this doesn't explain the low earnings growth the company has seen. So there might be other factors at play here which could potentially be hampering growth. For example, the business has faced some headwinds.
Conclusion
On the whole, we feel that the performance shown by Sanathan Textiles can be open to many interpretations. Even though it appears to be retaining most of its profits, given the low ROE, investors may not be benefitting from all that reinvestment after all. The low earnings growth suggests our theory correct. With that said, the latest industry analyst forecasts reveal that the company's earnings are expected to accelerate. Are these analysts expectations based on the broad expectations for the industry, or on the company's fundamentals? Click here to be taken to our analyst's forecasts page for the company.
New: Manage All Your Stock Portfolios in One Place
We've created the ultimate portfolio companion for stock investors, and it's free.
• Connect an unlimited number of Portfolios and see your total in one currency
• Be alerted to new Warning Signs or Risks via email or mobile
• Track the Fair Value of your stocks
Have feedback on this article? Concerned about the content? Get in touch with us directly. Alternatively, email editorial-team (at) simplywallst.com.
This article by Simply Wall St is general in nature. We provide commentary based on historical data and analyst forecasts only using an unbiased methodology and our articles are not intended to be financial advice. It does not constitute a recommendation to buy or sell any stock, and does not take account of your objectives, or your financial situation. We aim to bring you long-term focused analysis driven by fundamental data. Note that our analysis may not factor in the latest price-sensitive company announcements or qualitative material. Simply Wall St has no position in any stocks mentioned.
About NSEI:SANATHAN
Sanathan Textiles
Manufactures and supplies yarn in India and internationally.
High growth potential and good value.
Similar Companies
Market Insights


Advertisement
Community Narratives
A case for TSXV:USA to reach USD $5.00 - $9.00 (CAD $7.30–$12.29) by 2029.
Fair Value CA$12.29|91.1% undervalued
AG
Community Contributor
DLocal's Future Growth Fueled by 35% Revenue and Profit Margin Boosts
Fair Value US$195.39|94.2% undervalued
WY
Community Contributor
Historically Cheap, but the Margin of Safety Is Still Thin
Fair Value SEK 232.58|13.2% undervalued
MA
Community Contributor