
Advertisement
Do Its Financials Have Any Role To Play In Driving Pasupati Acrylon Limited's (NSE:PASUPTAC) Stock Up Recently?
Pasupati Acrylon's (NSE:PASUPTAC) stock is up by a considerable 15% over the past month. Given that stock prices are usually aligned with a company's financial performance in the long-term, we decided to study its financial indicators more closely to see if they had a hand to play in the recent price move. Specifically, we decided to study Pasupati Acrylon's ROE in this article.
Return on Equity or ROE is a test of how effectively a company is growing its value and managing investors’ money. In simpler terms, it measures the profitability of a company in relation to shareholder's equity.
Check out our latest analysis for Pasupati Acrylon
How Is ROE Calculated?
Return on equity can be calculated by using the formula:
Return on Equity = Net Profit (from continuing operations) ÷ Shareholders' Equity
So, based on the above formula, the ROE for Pasupati Acrylon is:
8.3% = ₹262m ÷ ₹3.2b (Based on the trailing twelve months to June 2023).
The 'return' is the profit over the last twelve months. So, this means that for every ₹1 of its shareholder's investments, the company generates a profit of ₹0.08.
What Is The Relationship Between ROE And Earnings Growth?
So far, we've learned that ROE is a measure of a company's profitability. Based on how much of its profits the company chooses to reinvest or "retain", we are then able to evaluate a company's future ability to generate profits. Assuming everything else remains unchanged, the higher the ROE and profit retention, the higher the growth rate of a company compared to companies that don't necessarily bear these characteristics.
A Side By Side comparison of Pasupati Acrylon's Earnings Growth And 8.3% ROE
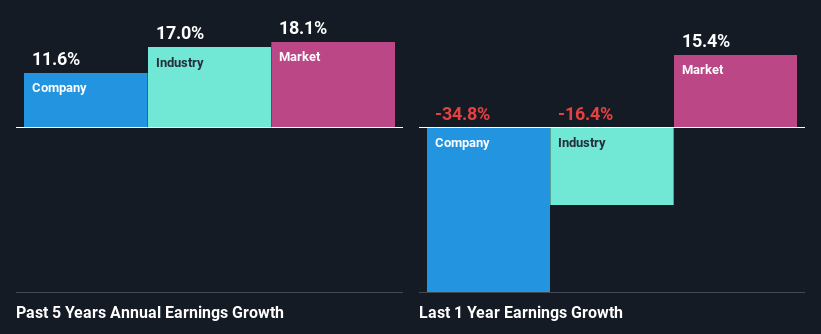
It is hard to argue that Pasupati Acrylon's ROE is much good in and of itself. An industry comparison shows that the company's ROE is not much different from the industry average of 7.9% either. So we are actually pleased to see that Pasupati Acrylon's net income grew at an acceptable rate of 12% over the last five years. We reckon that there could also be other factors at play that are influencing the company's growth. For instance, the company has a low payout ratio or is being managed efficiently.
Next, on comparing with the industry net income growth, we found that Pasupati Acrylon's reported growth was lower than the industry growth of 17% over the last few years, which is not something we like to see.
Earnings growth is a huge factor in stock valuation. What investors need to determine next is if the expected earnings growth, or the lack of it, is already built into the share price. Doing so will help them establish if the stock's future looks promising or ominous. Has the market priced in the future outlook for PASUPTAC? You can find out in our latest intrinsic value infographic research report
Is Pasupati Acrylon Using Its Retained Earnings Effectively?
Pasupati Acrylon doesn't pay any dividend, meaning that all of its profits are being reinvested in the business, which explains the fair bit of earnings growth the company has seen.
Conclusion
In total, it does look like Pasupati Acrylon has some positive aspects to its business. Specifically, its fairly high earnings growth number, which no doubt was backed by the company's high earnings retention. Still, the low ROE means that all that reinvestment is not reaping a lot of benefit to the investors. While we won't completely dismiss the company, what we would do, is try to ascertain how risky the business is to make a more informed decision around the company. Our risks dashboard will have the 1 risk we have identified for Pasupati Acrylon.
New: Manage All Your Stock Portfolios in One Place
We've created the ultimate portfolio companion for stock investors, and it's free.
• Connect an unlimited number of Portfolios and see your total in one currency
• Be alerted to new Warning Signs or Risks via email or mobile
• Track the Fair Value of your stocks
Have feedback on this article? Concerned about the content? Get in touch with us directly. Alternatively, email editorial-team (at) simplywallst.com.
This article by Simply Wall St is general in nature. We provide commentary based on historical data and analyst forecasts only using an unbiased methodology and our articles are not intended to be financial advice. It does not constitute a recommendation to buy or sell any stock, and does not take account of your objectives, or your financial situation. We aim to bring you long-term focused analysis driven by fundamental data. Note that our analysis may not factor in the latest price-sensitive company announcements or qualitative material. Simply Wall St has no position in any stocks mentioned.
About NSEI:PASUPTAC
Pasupati Acrylon
Manufactures and sells acrylic fibers, cast polypropylene (CPP) films in India.
Excellent balance sheet with acceptable track record.
Market Insights

Advertisement
Community Narratives
MINISO's fair value is projected at 26.69 with an anticipated PE ratio shift of 20x
Fair Value US$24.03|11.0% undervalued
BE
Community Contributor
Procter & Gamble: A Dividend Giant Facing Slowing Growth
Fair Value US$119.81|23.3% overvalued
AN
Community Contributor
Eli Lilly's Future Growth Driven by Tirzepatide and Favorable Market Conditions
Fair Value US$1.19k|13.8% undervalued
EA
Community Contributor