Liberty Shoes (NSE:LIBERTSHOE) sheds 10% this week, as yearly returns fall more in line with earnings growth


Liberty Shoes Ltd. (NSE:LIBERTSHOE) shareholders might be concerned after seeing the share price drop 10% in the last week. But that scarcely detracts from the really solid long term returns generated by the company over five years. It's fair to say most would be happy with 270% the gain in that time. We think it's more important to dwell on the long term returns than the short term returns. Only time will tell if there is still too much optimism currently reflected in the share price.
In light of the stock dropping 10% in the past week, we want to investigate the longer term story, and see if fundamentals have been the driver of the company's positive five-year return.
See our latest analysis for Liberty Shoes
While the efficient markets hypothesis continues to be taught by some, it has been proven that markets are over-reactive dynamic systems, and investors are not always rational. One way to examine how market sentiment has changed over time is to look at the interaction between a company's share price and its earnings per share (EPS).
Over half a decade, Liberty Shoes managed to grow its earnings per share at 10% a year. This EPS growth is slower than the share price growth of 30% per year, over the same period. This suggests that market participants hold the company in higher regard, these days. That's not necessarily surprising considering the five-year track record of earnings growth. This favorable sentiment is reflected in its (fairly optimistic) P/E ratio of 59.32.
The company's earnings per share (over time) is depicted in the image below (click to see the exact numbers).
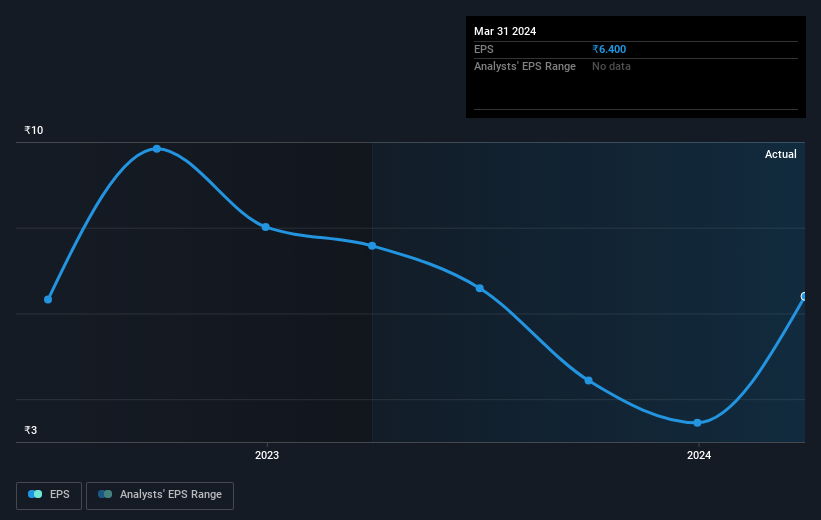
This free interactive report on Liberty Shoes' earnings, revenue and cash flow is a great place to start, if you want to investigate the stock further.
What About Dividends?
It is important to consider the total shareholder return, as well as the share price return, for any given stock. The TSR is a return calculation that accounts for the value of cash dividends (assuming that any dividend received was reinvested) and the calculated value of any discounted capital raisings and spin-offs. Arguably, the TSR gives a more comprehensive picture of the return generated by a stock. We note that for Liberty Shoes the TSR over the last 5 years was 274%, which is better than the share price return mentioned above. This is largely a result of its dividend payments!
A Different Perspective
We're pleased to report that Liberty Shoes shareholders have received a total shareholder return of 67% over one year. That's including the dividend. Since the one-year TSR is better than the five-year TSR (the latter coming in at 30% per year), it would seem that the stock's performance has improved in recent times. Given the share price momentum remains strong, it might be worth taking a closer look at the stock, lest you miss an opportunity. It's always interesting to track share price performance over the longer term. But to understand Liberty Shoes better, we need to consider many other factors. To that end, you should be aware of the 3 warning signs we've spotted with Liberty Shoes .
If you are like me, then you will not want to miss this free list of undervalued small caps that insiders are buying.
Please note, the market returns quoted in this article reflect the market weighted average returns of stocks that currently trade on Indian exchanges.
New: AI Stock Screener & Alerts
Our new AI Stock Screener scans the market every day to uncover opportunities.
• Dividend Powerhouses (3%+ Yield)
• Undervalued Small Caps with Insider Buying
• High growth Tech and AI Companies
Or build your own from over 50 metrics.
Have feedback on this article? Concerned about the content? Get in touch with us directly. Alternatively, email editorial-team (at) simplywallst.com.
This article by Simply Wall St is general in nature. We provide commentary based on historical data and analyst forecasts only using an unbiased methodology and our articles are not intended to be financial advice. It does not constitute a recommendation to buy or sell any stock, and does not take account of your objectives, or your financial situation. We aim to bring you long-term focused analysis driven by fundamental data. Note that our analysis may not factor in the latest price-sensitive company announcements or qualitative material. Simply Wall St has no position in any stocks mentioned.
Have feedback on this article? Concerned about the content? Get in touch with us directly. Alternatively, email editorial-team@simplywallst.com
About NSEI:LIBERTSHOE
Liberty Shoes
Manufactures and trades in footwear, accessories, and lifestyle products in India and internationally.
Acceptable track record with mediocre balance sheet.

