
Advertisement
Legendary fund manager Li Lu (who Charlie Munger backed) once said, 'The biggest investment risk is not the volatility of prices, but whether you will suffer a permanent loss of capital.' It's only natural to consider a company's balance sheet when you examine how risky it is, since debt is often involved when a business collapses. As with many other companies K.P.R. Mill Limited (NSE:KPRMILL) makes use of debt. But the more important question is: how much risk is that debt creating?
What Risk Does Debt Bring?
Debt is a tool to help businesses grow, but if a business is incapable of paying off its lenders, then it exists at their mercy. In the worst case scenario, a company can go bankrupt if it cannot pay its creditors. However, a more usual (but still expensive) situation is where a company must dilute shareholders at a cheap share price simply to get debt under control. Of course, plenty of companies use debt to fund growth, without any negative consequences. When we examine debt levels, we first consider both cash and debt levels, together.
How Much Debt Does K.P.R. Mill Carry?
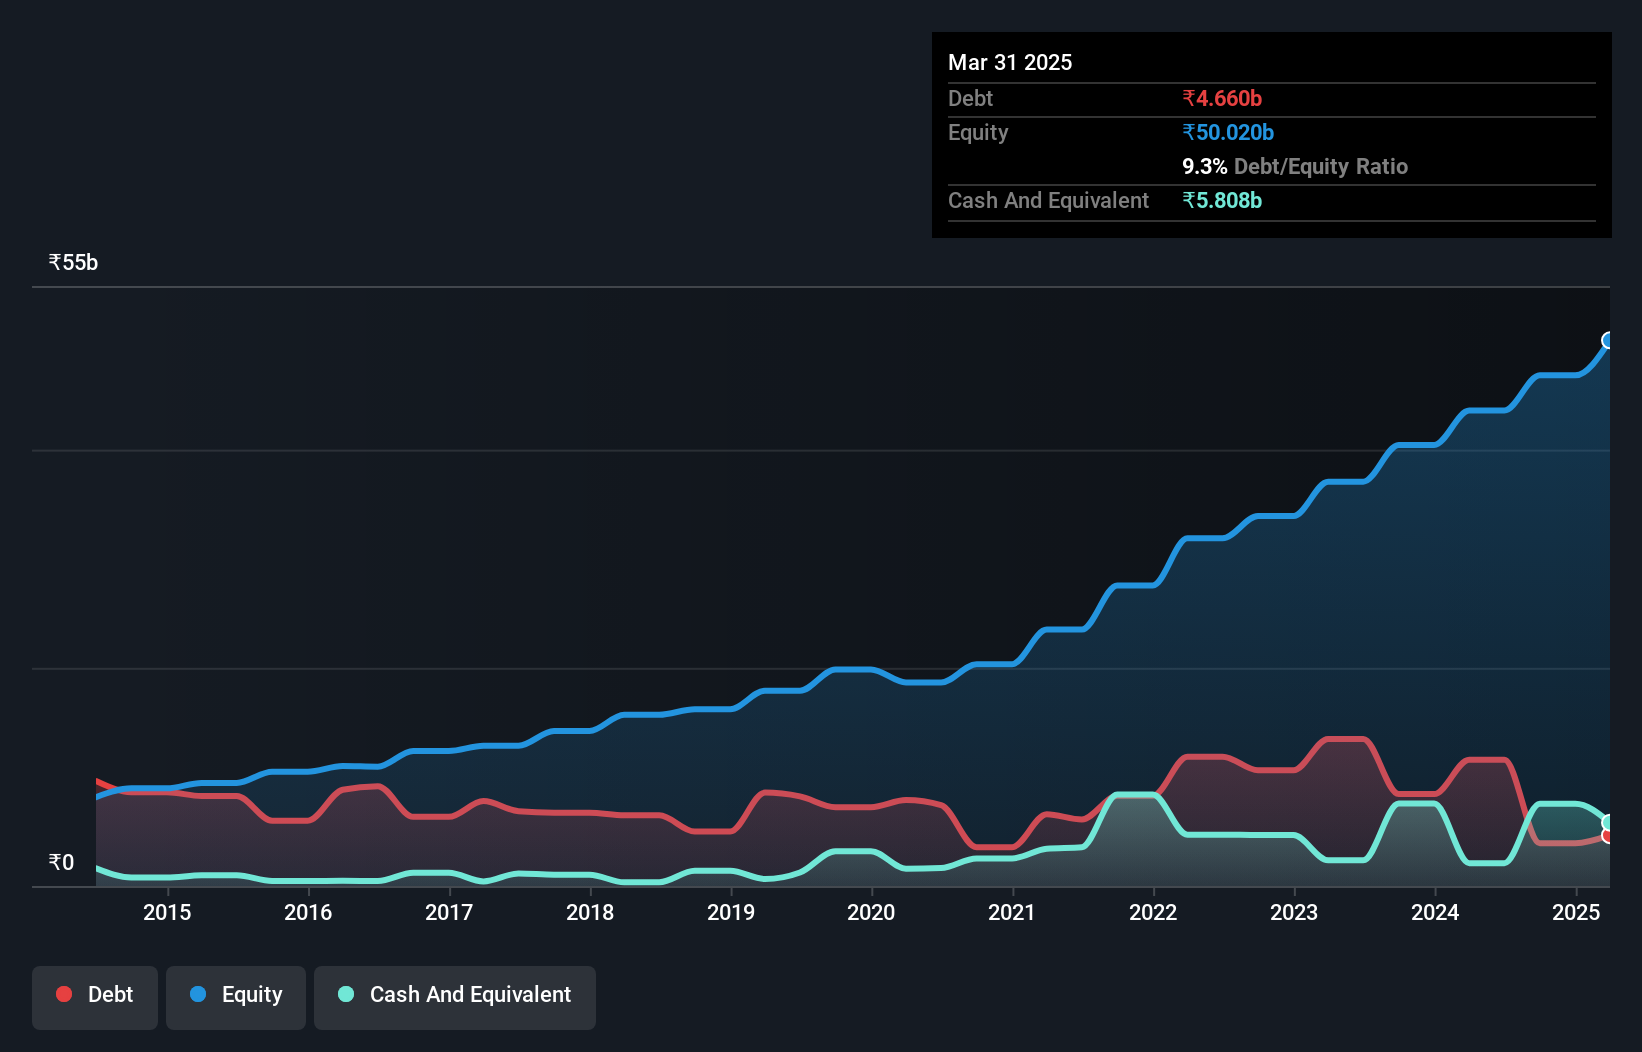
As you can see below, K.P.R. Mill had ₹4.66b of debt at March 2025, down from ₹11.6b a year prior. But on the other hand it also has ₹5.81b in cash, leading to a ₹1.15b net cash position.
A Look At K.P.R. Mill's Liabilities
Zooming in on the latest balance sheet data, we can see that K.P.R. Mill had liabilities of ₹7.75b due within 12 months and liabilities of ₹1.84b due beyond that. On the other hand, it had cash of ₹5.81b and ₹5.86b worth of receivables due within a year. So it actually has ₹2.07b more liquid assets than total liabilities.
Having regard to K.P.R. Mill's size, it seems that its liquid assets are well balanced with its total liabilities. So while it's hard to imagine that the ₹379.0b company is struggling for cash, we still think it's worth monitoring its balance sheet. Succinctly put, K.P.R. Mill boasts net cash, so it's fair to say it does not have a heavy debt load!
View our latest analysis for K.P.R. Mill
On the other hand, K.P.R. Mill saw its EBIT drop by 3.5% in the last twelve months. If earnings continue to decline at that rate the company may have increasing difficulty managing its debt load. The balance sheet is clearly the area to focus on when you are analysing debt. But it is future earnings, more than anything, that will determine K.P.R. Mill's ability to maintain a healthy balance sheet going forward. So if you're focused on the future you can check out this free report showing analyst profit forecasts.
But our final consideration is also important, because a company cannot pay debt with paper profits; it needs cold hard cash. K.P.R. Mill may have net cash on the balance sheet, but it is still interesting to look at how well the business converts its earnings before interest and tax (EBIT) to free cash flow, because that will influence both its need for, and its capacity to manage debt. In the last three years, K.P.R. Mill's free cash flow amounted to 47% of its EBIT, less than we'd expect. That weak cash conversion makes it more difficult to handle indebtedness.

Summing Up
While it is always sensible to investigate a company's debt, in this case K.P.R. Mill has ₹1.15b in net cash and a decent-looking balance sheet. So we don't have any problem with K.P.R. Mill's use of debt. There's no doubt that we learn most about debt from the balance sheet. However, not all investment risk resides within the balance sheet - far from it. For example - K.P.R. Mill has 1 warning sign we think you should be aware of.
If, after all that, you're more interested in a fast growing company with a rock-solid balance sheet, then check out our list of net cash growth stocks without delay.
Valuation is complex, but we're here to simplify it.
Discover if K.P.R. Mill might be undervalued or overvalued with our detailed analysis, featuring fair value estimates, potential risks, dividends, insider trades, and its financial condition.
Access Free AnalysisHave feedback on this article? Concerned about the content? Get in touch with us directly. Alternatively, email editorial-team (at) simplywallst.com.
This article by Simply Wall St is general in nature. We provide commentary based on historical data and analyst forecasts only using an unbiased methodology and our articles are not intended to be financial advice. It does not constitute a recommendation to buy or sell any stock, and does not take account of your objectives, or your financial situation. We aim to bring you long-term focused analysis driven by fundamental data. Note that our analysis may not factor in the latest price-sensitive company announcements or qualitative material. Simply Wall St has no position in any stocks mentioned.
About NSEI:KPRMILL
K.P.R. Mill
Operates as an integrated apparel manufacturing company in India and internationally.
Flawless balance sheet average dividend payer.
Similar Companies
Market Insights

Advertisement
Community Narratives
The company that turned a verb into a global necessity and basically runs the modern internet, digital ads, smartphones, maps, and AI.
Fair Value US$300.00|6.3% undervalued
OS
Community Contributor
Flowers Foods Pays A Fair Price For Health
Fair Value US$16.12|26.0% undervalued
NV
Community Contributor
TMX Group will thrive with 33.3% profit margin and enduring market moat
Fair Value CA$49.90|3.7% overvalued
LI
Community Contributor