
Advertisement
- India
- /
- Consumer Durables
- /
- NSEI:AMBER
Amber Enterprises India (NSE:AMBER) Could Be Struggling To Allocate Capital

There are a few key trends to look for if we want to identify the next multi-bagger. Typically, we'll want to notice a trend of growing return on capital employed (ROCE) and alongside that, an expanding base of capital employed. Basically this means that a company has profitable initiatives that it can continue to reinvest in, which is a trait of a compounding machine. Although, when we looked at Amber Enterprises India (NSE:AMBER), it didn't seem to tick all of these boxes.
What is Return On Capital Employed (ROCE)?
Just to clarify if you're unsure, ROCE is a metric for evaluating how much pre-tax income (in percentage terms) a company earns on the capital invested in its business. The formula for this calculation on Amber Enterprises India is:
Return on Capital Employed = Earnings Before Interest and Tax (EBIT) ÷ (Total Assets - Current Liabilities)
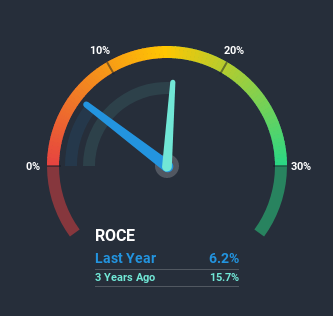
0.062 = ₹1.1b ÷ (₹25b - ₹7.6b) (Based on the trailing twelve months to December 2020).
Thus, Amber Enterprises India has an ROCE of 6.2%. Ultimately, that's a low return and it under-performs the Consumer Durables industry average of 11%.
View our latest analysis for Amber Enterprises India
Above you can see how the current ROCE for Amber Enterprises India compares to its prior returns on capital, but there's only so much you can tell from the past. If you'd like to see what analysts are forecasting going forward, you should check out our free report for Amber Enterprises India.
What Does the ROCE Trend For Amber Enterprises India Tell Us?
In terms of Amber Enterprises India's historical ROCE movements, the trend isn't fantastic. To be more specific, ROCE has fallen from 18% over the last five years. And considering revenue has dropped while employing more capital, we'd be cautious. If this were to continue, you might be looking at a company that is trying to reinvest for growth but is actually losing market share since sales haven't increased.
On a related note, Amber Enterprises India has decreased its current liabilities to 30% of total assets. So we could link some of this to the decrease in ROCE. Effectively this means their suppliers or short-term creditors are funding less of the business, which reduces some elements of risk. Since the business is basically funding more of its operations with it's own money, you could argue this has made the business less efficient at generating ROCE.
What We Can Learn From Amber Enterprises India's ROCE
We're a bit apprehensive about Amber Enterprises India because despite more capital being deployed in the business, returns on that capital and sales have both fallen. Since the stock has skyrocketed 188% over the last three years, it looks like investors have high expectations of the stock. In any case, the current underlying trends don't bode well for long term performance so unless they reverse, we'd start looking elsewhere.
On a final note, we've found 2 warning signs for Amber Enterprises India that we think you should be aware of.
If you want to search for solid companies with great earnings, check out this free list of companies with good balance sheets and impressive returns on equity.
If you’re looking to trade Amber Enterprises India, open an account with the lowest-cost* platform trusted by professionals, Interactive Brokers. Their clients from over 200 countries and territories trade stocks, options, futures, forex, bonds and funds worldwide from a single integrated account. Promoted
New: Manage All Your Stock Portfolios in One Place
We've created the ultimate portfolio companion for stock investors, and it's free.
• Connect an unlimited number of Portfolios and see your total in one currency
• Be alerted to new Warning Signs or Risks via email or mobile
• Track the Fair Value of your stocks
This article by Simply Wall St is general in nature. It does not constitute a recommendation to buy or sell any stock, and does not take account of your objectives, or your financial situation. We aim to bring you long-term focused analysis driven by fundamental data. Note that our analysis may not factor in the latest price-sensitive company announcements or qualitative material. Simply Wall St has no position in any stocks mentioned.
*Interactive Brokers Rated Lowest Cost Broker by StockBrokers.com Annual Online Review 2020
Have feedback on this article? Concerned about the content? Get in touch with us directly. Alternatively, email editorial-team (at) simplywallst.com.
About NSEI:AMBER
Amber Enterprises India
Provides room air conditioner solutions in India.
High growth potential with solid track record.
Market Insights


Advertisement
Community Narratives
A case for TSXV:USA to reach USD $5.00 - $9.00 (CAD $7.30–$12.29) by 2029.
Fair Value CA$12.29|91.1% undervalued
AG
Community Contributor
DLocal's Future Growth Fueled by 35% Revenue and Profit Margin Boosts
Fair Value US$195.39|94.2% undervalued
WY
Community Contributor
Historically Cheap, but the Margin of Safety Is Still Thin
Fair Value SEK 232.58|13.2% undervalued
MA
Community Contributor