
Advertisement
- India
- /
- Commercial Services
- /
- NSEI:MALLCOM
Are Robust Financials Driving The Recent Rally In Mallcom (India) Limited's (NSE:MALLCOM) Stock?
Mallcom (India)'s (NSE:MALLCOM) stock is up by a considerable 25% over the past week. Given the company's impressive performance, we decided to study its financial indicators more closely as a company's financial health over the long-term usually dictates market outcomes. In this article, we decided to focus on Mallcom (India)'s ROE.
Return on Equity or ROE is a test of how effectively a company is growing its value and managing investors’ money. In short, ROE shows the profit each dollar generates with respect to its shareholder investments.
See our latest analysis for Mallcom (India)
How Do You Calculate Return On Equity?
Return on equity can be calculated by using the formula:
Return on Equity = Net Profit (from continuing operations) ÷ Shareholders' Equity
So, based on the above formula, the ROE for Mallcom (India) is:
16% = ₹343m ÷ ₹2.2b (Based on the trailing twelve months to December 2023).
The 'return' is the amount earned after tax over the last twelve months. So, this means that for every ₹1 of its shareholder's investments, the company generates a profit of ₹0.16.
Why Is ROE Important For Earnings Growth?
Thus far, we have learned that ROE measures how efficiently a company is generating its profits. Based on how much of its profits the company chooses to reinvest or "retain", we are then able to evaluate a company's future ability to generate profits. Generally speaking, other things being equal, firms with a high return on equity and profit retention, have a higher growth rate than firms that don’t share these attributes.
A Side By Side comparison of Mallcom (India)'s Earnings Growth And 16% ROE
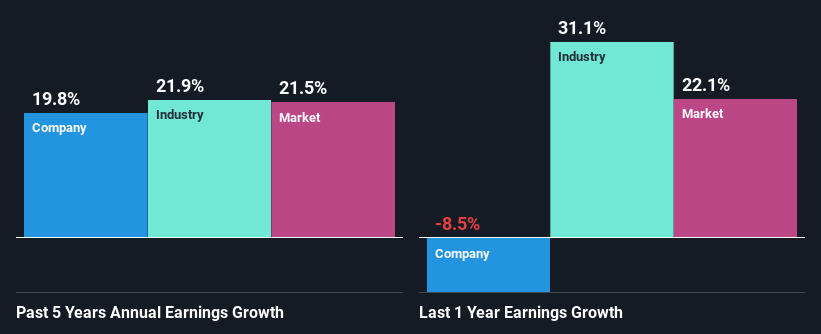
To begin with, Mallcom (India) seems to have a respectable ROE. Further, the company's ROE is similar to the industry average of 14%. Consequently, this likely laid the ground for the decent growth of 20% seen over the past five years by Mallcom (India).
Next, on comparing Mallcom (India)'s net income growth with the industry, we found that the company's reported growth is similar to the industry average growth rate of 22% over the last few years.
The basis for attaching value to a company is, to a great extent, tied to its earnings growth. It’s important for an investor to know whether the market has priced in the company's expected earnings growth (or decline). This then helps them determine if the stock is placed for a bright or bleak future. Is Mallcom (India) fairly valued compared to other companies? These 3 valuation measures might help you decide.
Is Mallcom (India) Efficiently Re-investing Its Profits?
In Mallcom (India)'s case, its respectable earnings growth can probably be explained by its low three-year median payout ratio of 5.7% (or a retention ratio of 94%), which suggests that the company is investing most of its profits to grow its business.
Additionally, Mallcom (India) has paid dividends over a period of eight years which means that the company is pretty serious about sharing its profits with shareholders.
Conclusion
Overall, we are quite pleased with Mallcom (India)'s performance. In particular, it's great to see that the company is investing heavily into its business and along with a high rate of return, that has resulted in a sizeable growth in its earnings. If the company continues to grow its earnings the way it has, that could have a positive impact on its share price given how earnings per share influence long-term share prices. Let's not forget, business risk is also one of the factors that affects the price of the stock. So this is also an important area that investors need to pay attention to before making a decision on any business. Our risks dashboard will have the 1 risk we have identified for Mallcom (India).
New: Manage All Your Stock Portfolios in One Place
We've created the ultimate portfolio companion for stock investors, and it's free.
• Connect an unlimited number of Portfolios and see your total in one currency
• Be alerted to new Warning Signs or Risks via email or mobile
• Track the Fair Value of your stocks
Have feedback on this article? Concerned about the content? Get in touch with us directly. Alternatively, email editorial-team (at) simplywallst.com.
This article by Simply Wall St is general in nature. We provide commentary based on historical data and analyst forecasts only using an unbiased methodology and our articles are not intended to be financial advice. It does not constitute a recommendation to buy or sell any stock, and does not take account of your objectives, or your financial situation. We aim to bring you long-term focused analysis driven by fundamental data. Note that our analysis may not factor in the latest price-sensitive company announcements or qualitative material. Simply Wall St has no position in any stocks mentioned.
About NSEI:MALLCOM
Mallcom (India)
Engages in the manufacture and sale of personal protective equipment in India and internationally.
Proven track record with adequate balance sheet.
Similar Companies
Market Insights

Advertisement
Community Narratives
MINISO's fair value is projected at 26.69 with an anticipated PE ratio shift of 20x
Fair Value US$24.03|11.0% undervalued
BE
Community Contributor
Procter & Gamble: A Dividend Giant Facing Slowing Growth
Fair Value US$119.81|23.3% overvalued
AN
Community Contributor
Eli Lilly's Future Growth Driven by Tirzepatide and Favorable Market Conditions
Fair Value US$1.19k|13.8% undervalued
EA
Community Contributor