
Advertisement
- India
- /
- Professional Services
- /
- NSEI:ECLERX
These 4 Measures Indicate That eClerx Services (NSE:ECLERX) Is Using Debt Safely
Warren Buffett famously said, 'Volatility is far from synonymous with risk.' When we think about how risky a company is, we always like to look at its use of debt, since debt overload can lead to ruin. We can see that eClerx Services Limited (NSE:ECLERX) does use debt in its business. But the real question is whether this debt is making the company risky.
When Is Debt Dangerous?
Debt and other liabilities become risky for a business when it cannot easily fulfill those obligations, either with free cash flow or by raising capital at an attractive price. In the worst case scenario, a company can go bankrupt if it cannot pay its creditors. However, a more usual (but still expensive) situation is where a company must dilute shareholders at a cheap share price simply to get debt under control. Of course, the upside of debt is that it often represents cheap capital, especially when it replaces dilution in a company with the ability to reinvest at high rates of return. When we examine debt levels, we first consider both cash and debt levels, together.
View our latest analysis for eClerx Services
How Much Debt Does eClerx Services Carry?
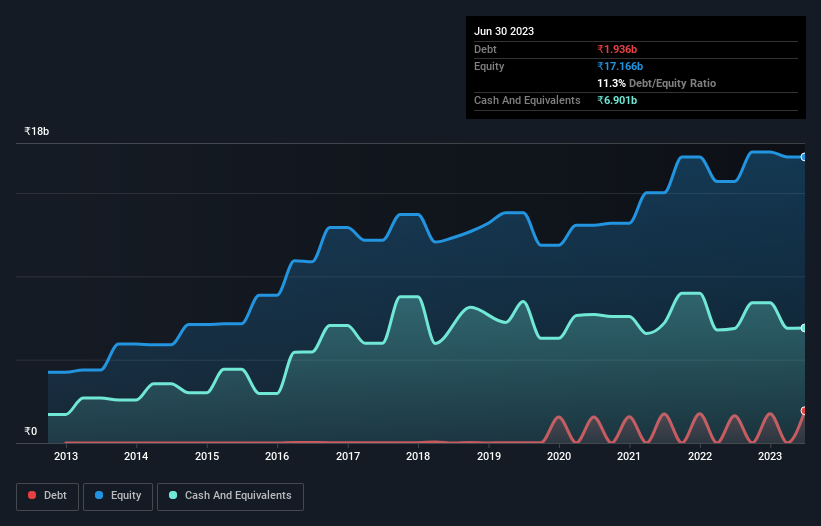
The image below, which you can click on for greater detail, shows that at March 2023 eClerx Services had debt of ₹1.94b, up from ₹1.63b in one year. But it also has ₹6.90b in cash to offset that, meaning it has ₹4.97b net cash.
How Healthy Is eClerx Services' Balance Sheet?
The latest balance sheet data shows that eClerx Services had liabilities of ₹3.50b due within a year, and liabilities of ₹2.21b falling due after that. Offsetting this, it had ₹6.90b in cash and ₹6.35b in receivables that were due within 12 months. So it actually has ₹7.54b more liquid assets than total liabilities.
This surplus suggests that eClerx Services has a conservative balance sheet, and could probably eliminate its debt without much difficulty. Simply put, the fact that eClerx Services has more cash than debt is arguably a good indication that it can manage its debt safely.
The good news is that eClerx Services has increased its EBIT by 8.4% over twelve months, which should ease any concerns about debt repayment. The balance sheet is clearly the area to focus on when you are analysing debt. But it is future earnings, more than anything, that will determine eClerx Services's ability to maintain a healthy balance sheet going forward. So if you want to see what the professionals think, you might find this free report on analyst profit forecasts to be interesting.
But our final consideration is also important, because a company cannot pay debt with paper profits; it needs cold hard cash. While eClerx Services has net cash on its balance sheet, it's still worth taking a look at its ability to convert earnings before interest and tax (EBIT) to free cash flow, to help us understand how quickly it is building (or eroding) that cash balance. During the last three years, eClerx Services produced sturdy free cash flow equating to 70% of its EBIT, about what we'd expect. This free cash flow puts the company in a good position to pay down debt, when appropriate.
Summing Up
While it is always sensible to investigate a company's debt, in this case eClerx Services has ₹4.97b in net cash and a decent-looking balance sheet. And it impressed us with free cash flow of ₹4.0b, being 70% of its EBIT. So we don't think eClerx Services's use of debt is risky. Over time, share prices tend to follow earnings per share, so if you're interested in eClerx Services, you may well want to click here to check an interactive graph of its earnings per share history.
If, after all that, you're more interested in a fast growing company with a rock-solid balance sheet, then check out our list of net cash growth stocks without delay.
New: Manage All Your Stock Portfolios in One Place
We've created the ultimate portfolio companion for stock investors, and it's free.
• Connect an unlimited number of Portfolios and see your total in one currency
• Be alerted to new Warning Signs or Risks via email or mobile
• Track the Fair Value of your stocks
Have feedback on this article? Concerned about the content? Get in touch with us directly. Alternatively, email editorial-team (at) simplywallst.com.
This article by Simply Wall St is general in nature. We provide commentary based on historical data and analyst forecasts only using an unbiased methodology and our articles are not intended to be financial advice. It does not constitute a recommendation to buy or sell any stock, and does not take account of your objectives, or your financial situation. We aim to bring you long-term focused analysis driven by fundamental data. Note that our analysis may not factor in the latest price-sensitive company announcements or qualitative material. Simply Wall St has no position in any stocks mentioned.
About NSEI:ECLERX
eClerx Services
Provides business process management, change management, data-driven insights, and advanced analytics services in India, the United States, the United Kingdom, Europe, and the Asia Pacific.
Flawless balance sheet with solid track record.
Similar Companies
Market Insights

Advertisement
Community Narratives
MINISO's fair value is projected at 26.69 with an anticipated PE ratio shift of 20x
Fair Value US$24.03|9.0% undervalued
BE
Community Contributor
Procter & Gamble: A Dividend Giant Facing Slowing Growth
Fair Value US$119.81|23.5% overvalued
AN
Community Contributor
Eli Lilly's Future Growth Driven by Tirzepatide and Favorable Market Conditions
Fair Value US$1.19k|14.4% undervalued
EA
Community Contributor