
Advertisement
Is Vesuvius India Limited's (NSE:VESUVIUS) Recent Stock Performance Tethered To Its Strong Fundamentals?

Most readers would already be aware that Vesuvius India's (NSE:VESUVIUS) stock increased significantly by 14% over the past month. Given that the market rewards strong financials in the long-term, we wonder if that is the case in this instance. Specifically, we decided to study Vesuvius India's ROE in this article.
Return on equity or ROE is an important factor to be considered by a shareholder because it tells them how effectively their capital is being reinvested. Put another way, it reveals the company's success at turning shareholder investments into profits.
See our latest analysis for Vesuvius India
How Is ROE Calculated?
Return on equity can be calculated by using the formula:
Return on Equity = Net Profit (from continuing operations) ÷ Shareholders' Equity
So, based on the above formula, the ROE for Vesuvius India is:
19% = ₹2.5b ÷ ₹13b (Based on the trailing twelve months to June 2024).
The 'return' is the income the business earned over the last year. Another way to think of that is that for every ₹1 worth of equity, the company was able to earn ₹0.19 in profit.
What Is The Relationship Between ROE And Earnings Growth?
We have already established that ROE serves as an efficient profit-generating gauge for a company's future earnings. Depending on how much of these profits the company reinvests or "retains", and how effectively it does so, we are then able to assess a company’s earnings growth potential. Generally speaking, other things being equal, firms with a high return on equity and profit retention, have a higher growth rate than firms that don’t share these attributes.
Vesuvius India's Earnings Growth And 19% ROE
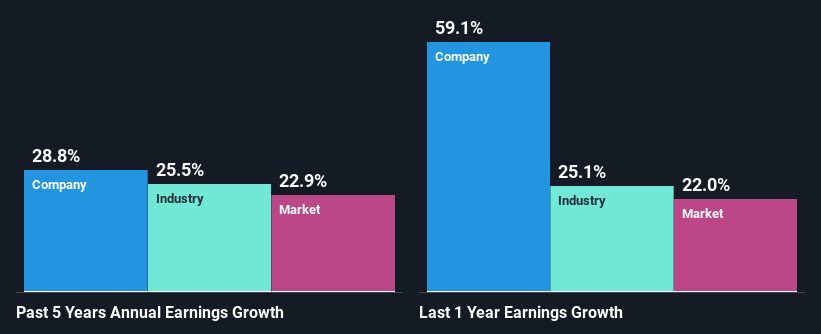
To start with, Vesuvius India's ROE looks acceptable. Especially when compared to the industry average of 15% the company's ROE looks pretty impressive. Probably as a result of this, Vesuvius India was able to see an impressive net income growth of 29% over the last five years. We believe that there might also be other aspects that are positively influencing the company's earnings growth. Such as - high earnings retention or an efficient management in place.
Next, on comparing Vesuvius India's net income growth with the industry, we found that the company's reported growth is similar to the industry average growth rate of 25% over the last few years.
The basis for attaching value to a company is, to a great extent, tied to its earnings growth. What investors need to determine next is if the expected earnings growth, or the lack of it, is already built into the share price. This then helps them determine if the stock is placed for a bright or bleak future. Is Vesuvius India fairly valued compared to other companies? These 3 valuation measures might help you decide.
Is Vesuvius India Using Its Retained Earnings Effectively?
Vesuvius India's three-year median payout ratio to shareholders is 17%, which is quite low. This implies that the company is retaining 83% of its profits. This suggests that the management is reinvesting most of the profits to grow the business as evidenced by the growth seen by the company.
Besides, Vesuvius India has been paying dividends for at least ten years or more. This shows that the company is committed to sharing profits with its shareholders.
Conclusion
In total, we are pretty happy with Vesuvius India's performance. Specifically, we like that the company is reinvesting a huge chunk of its profits at a high rate of return. This of course has caused the company to see substantial growth in its earnings. With that said, the latest industry analyst forecasts reveal that the company's earnings growth is expected to slow down. Are these analysts expectations based on the broad expectations for the industry, or on the company's fundamentals? Click here to be taken to our analyst's forecasts page for the company.
New: Manage All Your Stock Portfolios in One Place
We've created the ultimate portfolio companion for stock investors, and it's free.
• Connect an unlimited number of Portfolios and see your total in one currency
• Be alerted to new Warning Signs or Risks via email or mobile
• Track the Fair Value of your stocks
Have feedback on this article? Concerned about the content? Get in touch with us directly. Alternatively, email editorial-team (at) simplywallst.com.
This article by Simply Wall St is general in nature. We provide commentary based on historical data and analyst forecasts only using an unbiased methodology and our articles are not intended to be financial advice. It does not constitute a recommendation to buy or sell any stock, and does not take account of your objectives, or your financial situation. We aim to bring you long-term focused analysis driven by fundamental data. Note that our analysis may not factor in the latest price-sensitive company announcements or qualitative material. Simply Wall St has no position in any stocks mentioned.
About NSEI:VESUVIUS
Excellent balance sheet with moderate growth potential.
Similar Companies
Market Insights


Advertisement
Community Narratives
A case for TSXV:USA to reach USD $5.00 - $9.00 (CAD $7.30–$12.29) by 2029.
Fair Value CA$12.29|91.2% undervalued
AG
Community Contributor
DLocal's Future Growth Fueled by 35% Revenue and Profit Margin Boosts
Fair Value US$195.39|94.1% undervalued
WY
Community Contributor
Historically Cheap, but the Margin of Safety Is Still Thin
Fair Value SEK 232.58|12.7% undervalued
MA
Community Contributor