
Despite posting strong earnings, TIL Limited's (NSE:TIL) stock didn't move much over the last week. We looked deeper into the numbers and found that shareholders might be concerned with some underlying weaknesses.
See our latest analysis for TIL
A Closer Look At TIL's Earnings
One key financial ratio used to measure how well a company converts its profit to free cash flow (FCF) is the accrual ratio. To get the accrual ratio we first subtract FCF from profit for a period, and then divide that number by the average operating assets for the period. You could think of the accrual ratio from cashflow as the 'non-FCF profit ratio'.
That means a negative accrual ratio is a good thing, because it shows that the company is bringing in more free cash flow than its profit would suggest. That is not intended to imply we should worry about a positive accrual ratio, but it's worth noting where the accrual ratio is rather high. Notably, there is some academic evidence that suggests that a high accrual ratio is a bad sign for near-term profits, generally speaking.
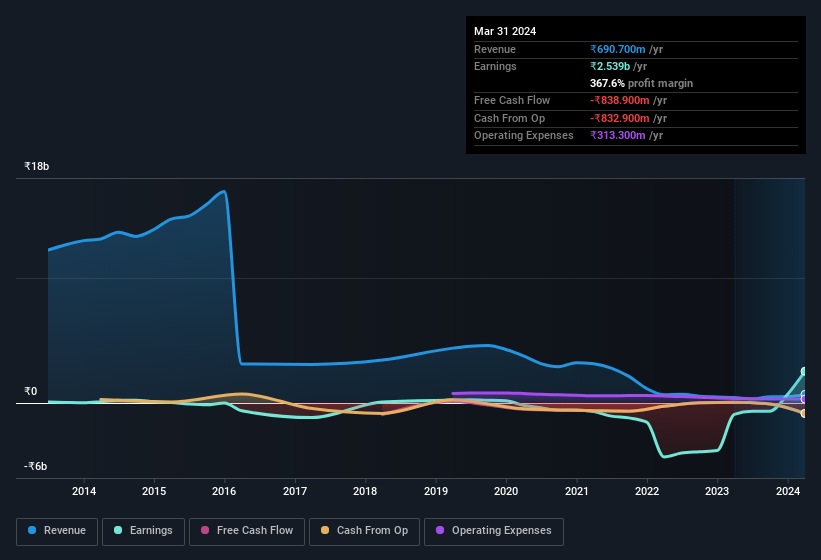
TIL has an accrual ratio of 2.38 for the year to March 2024. As a general rule, that bodes poorly for future profitability. To wit, the company did not generate one whit of free cashflow in that time. In the last twelve months it actually had negative free cash flow, with an outflow of ₹839m despite its profit of ₹2.54b, mentioned above. It's worth noting that TIL generated positive FCF of ₹56m a year ago, so at least they've done it in the past. Having said that, there is more to consider. We must also consider the impact of unusual items on statutory profit (and thus the accrual ratio), as well as note the ramifications of the company issuing new shares. The good news for shareholders is that TIL's accrual ratio was much better last year, so this year's poor reading might simply be a case of a short term mismatch between profit and FCF. Shareholders should look for improved cashflow relative to profit in the current year, if that is indeed the case.
Note: we always recommend investors check balance sheet strength. Click here to be taken to our balance sheet analysis of TIL.
In order to understand the potential for per share returns, it is essential to consider how much a company is diluting shareholders. TIL expanded the number of shares on issue by 564% over the last year. As a result, its net income is now split between a greater number of shares. To celebrate net income while ignoring dilution is like rejoicing because you have a single slice of a larger pizza, but ignoring the fact that the pizza is now cut into many more slices. Check out TIL's historical EPS growth by clicking on this link.
How Is Dilution Impacting TIL's Earnings Per Share (EPS)?
Three years ago, TIL lost money. Zooming in to the last year, we still can't talk about growth rates coherently, since it made a loss last year. But mathematics aside, it is always good to see when a formerly unprofitable business come good (though we accept profit would have been higher if dilution had not been required). So you can see that the dilution has had a fairly significant impact on shareholders.
If TIL's EPS can grow over time then that drastically improves the chances of the share price moving in the same direction. However, if its profit increases while its earnings per share stay flat (or even fall) then shareholders might not see much benefit. For the ordinary retail shareholder, EPS is a great measure to check your hypothetical "share" of the company's profit.
The Impact Of Unusual Items On Profit
The fact that the company had unusual items boosting profit by ₹3.0b, in the last year, probably goes some way to explain why its accrual ratio was so weak. While it's always nice to have higher profit, a large contribution from unusual items sometimes dampens our enthusiasm. We ran the numbers on most publicly listed companies worldwide, and it's very common for unusual items to be once-off in nature. Which is hardly surprising, given the name. We can see that TIL's positive unusual items were quite significant relative to its profit in the year to March 2024. As a result, we can surmise that the unusual items are making its statutory profit significantly stronger than it would otherwise be.
Our Take On TIL's Profit Performance
TIL didn't back up its earnings with free cashflow, but this isn't too surprising given profits were inflated by unusual items. The dilution means the results are weaker when viewed from a per-share perspective. On reflection, the above-mentioned factors give us the strong impression that TIL'sunderlying earnings power is not as good as it might seem, based on the statutory profit numbers. If you want to do dive deeper into TIL, you'd also look into what risks it is currently facing. At Simply Wall St, we found 4 warning signs for TIL and we think they deserve your attention.
In this article we've looked at a number of factors that can impair the utility of profit numbers, and we've come away cautious. But there is always more to discover if you are capable of focussing your mind on minutiae. For example, many people consider a high return on equity as an indication of favorable business economics, while others like to 'follow the money' and search out stocks that insiders are buying. While it might take a little research on your behalf, you may find this free collection of companies boasting high return on equity, or this list of stocks with significant insider holdings to be useful.
The New Payments ETF Is Live on NASDAQ:
Money is moving to real-time rails, and a newly listed ETF now gives investors direct exposure. Fast settlement. Institutional custody. Simple access.
Explore how this launch could reshape portfolios
Sponsored ContentValuation is complex, but we're here to simplify it.
Discover if TIL might be undervalued or overvalued with our detailed analysis, featuring fair value estimates, potential risks, dividends, insider trades, and its financial condition.
Access Free AnalysisHave feedback on this article? Concerned about the content? Get in touch with us directly. Alternatively, email editorial-team (at) simplywallst.com.
This article by Simply Wall St is general in nature. We provide commentary based on historical data and analyst forecasts only using an unbiased methodology and our articles are not intended to be financial advice. It does not constitute a recommendation to buy or sell any stock, and does not take account of your objectives, or your financial situation. We aim to bring you long-term focused analysis driven by fundamental data. Note that our analysis may not factor in the latest price-sensitive company announcements or qualitative material. Simply Wall St has no position in any stocks mentioned.
About NSEI:TIL
TIL
Together with its subsidiary, TIL Overseas PTE Limited, provides materials handling solutions in India and internationally.
Imperfect balance sheet with weak fundamentals.
Similar Companies
Market Insights

Weekly Picks

Early mover in a fast growing industry. Likely to experience share price volatility as they scale


A case for CA$31.80 (undiluted), aka 8,616% upside from CA$0.37 (an 86 bagger!).


Moderation and Stabilisation: HOLD: Fair Price based on a 4-year Cycle is $12.08
Recently Updated Narratives


Title: Market Sentiment Is Dead Wrong — Here's Why PSEC Deserves a Second Look


An amazing opportunity to potentially get a 100 bagger

Amazon: Why the World’s Biggest Platform Still Runs on Invisible Economics
Popular Narratives


Crazy Undervalued 42 Baggers Silver Play (Active & Running Mine)


MicroVision will explode future revenue by 380.37% with a vision towards success


NVDA: Expanding AI Demand Will Drive Major Data Center Investments Through 2026
Trending Discussion
