
Advertisement
- India
- /
- Construction
- /
- NSEI:SPMLINFRA
Some Investors May Be Worried About SPML Infra's (NSE:SPMLINFRA) Returns On Capital
What underlying fundamental trends can indicate that a company might be in decline? More often than not, we'll see a declining return on capital employed (ROCE) and a declining amount of capital employed. This indicates to us that the business is not only shrinking the size of its net assets, but its returns are falling as well. On that note, looking into SPML Infra (NSE:SPMLINFRA), we weren't too upbeat about how things were going.
What Is Return On Capital Employed (ROCE)?
For those that aren't sure what ROCE is, it measures the amount of pre-tax profits a company can generate from the capital employed in its business. The formula for this calculation on SPML Infra is:
Return on Capital Employed = Earnings Before Interest and Tax (EBIT) ÷ (Total Assets - Current Liabilities)
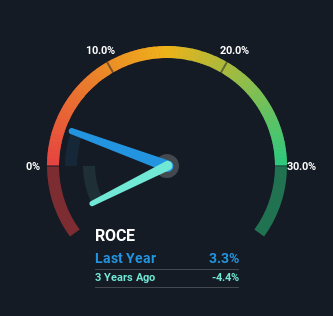
0.033 = ₹396m ÷ (₹28b - ₹16b) (Based on the trailing twelve months to December 2023).
Thus, SPML Infra has an ROCE of 3.3%. Ultimately, that's a low return and it under-performs the Construction industry average of 14%.
Check out our latest analysis for SPML Infra
While the past is not representative of the future, it can be helpful to know how a company has performed historically, which is why we have this chart above. If you want to delve into the historical earnings , check out these free graphs detailing revenue and cash flow performance of SPML Infra.
So How Is SPML Infra's ROCE Trending?
There is reason to be cautious about SPML Infra, given the returns are trending downwards. About five years ago, returns on capital were 12%, however they're now substantially lower than that as we saw above. On top of that, it's worth noting that the amount of capital employed within the business has remained relatively steady. Companies that exhibit these attributes tend to not be shrinking, but they can be mature and facing pressure on their margins from competition. So because these trends aren't typically conducive to creating a multi-bagger, we wouldn't hold our breath on SPML Infra becoming one if things continue as they have.
On a side note, SPML Infra's current liabilities are still rather high at 58% of total assets. This effectively means that suppliers (or short-term creditors) are funding a large portion of the business, so just be aware that this can introduce some elements of risk. While it's not necessarily a bad thing, it can be beneficial if this ratio is lower.
In Conclusion...
In summary, it's unfortunate that SPML Infra is generating lower returns from the same amount of capital. Since the stock has skyrocketed 203% over the last five years, it looks like investors have high expectations of the stock. In any case, the current underlying trends don't bode well for long term performance so unless they reverse, we'd start looking elsewhere.
If you'd like to know more about SPML Infra, we've spotted 4 warning signs, and 2 of them make us uncomfortable.
If you want to search for solid companies with great earnings, check out this free list of companies with good balance sheets and impressive returns on equity.
New: Manage All Your Stock Portfolios in One Place
We've created the ultimate portfolio companion for stock investors, and it's free.
• Connect an unlimited number of Portfolios and see your total in one currency
• Be alerted to new Warning Signs or Risks via email or mobile
• Track the Fair Value of your stocks
Have feedback on this article? Concerned about the content? Get in touch with us directly. Alternatively, email editorial-team (at) simplywallst.com.
This article by Simply Wall St is general in nature. We provide commentary based on historical data and analyst forecasts only using an unbiased methodology and our articles are not intended to be financial advice. It does not constitute a recommendation to buy or sell any stock, and does not take account of your objectives, or your financial situation. We aim to bring you long-term focused analysis driven by fundamental data. Note that our analysis may not factor in the latest price-sensitive company announcements or qualitative material. Simply Wall St has no position in any stocks mentioned.
About NSEI:SPMLINFRA
Solid track record with adequate balance sheet.
Similar Companies
Market Insights

Advertisement
Community Narratives
MINISO's fair value is projected at 26.69 with an anticipated PE ratio shift of 20x
Fair Value US$24.03|12.0% undervalued
BE
Community Contributor
Procter & Gamble: A Dividend Giant Facing Slowing Growth
Fair Value US$119.81|21.7% overvalued
AN
Community Contributor
Eli Lilly's Future Growth Driven by Tirzepatide and Favorable Market Conditions
Fair Value US$1.19k|14.1% undervalued
EA
Community Contributor