
Advertisement
- India
- /
- Construction
- /
- NSEI:SPMLINFRA
Investors Still Aren't Entirely Convinced By SPML Infra Limited's (NSE:SPMLINFRA) Revenues Despite 27% Price Jump
SPML Infra Limited (NSE:SPMLINFRA) shareholders would be excited to see that the share price has had a great month, posting a 27% gain and recovering from prior weakness. This latest share price bounce rounds out a remarkable 425% gain over the last twelve months.
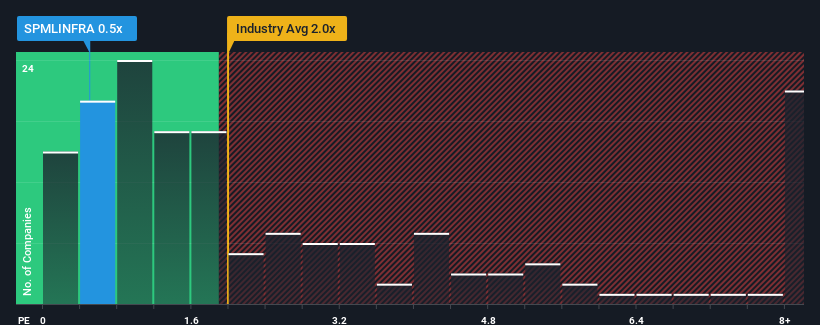
In spite of the firm bounce in price, SPML Infra may still be sending buy signals at present with its price-to-sales (or "P/S") ratio of 0.5x, considering almost half of all companies in the Construction industry in India have P/S ratios greater than 2x and even P/S higher than 5x aren't out of the ordinary. However, the P/S might be low for a reason and it requires further investigation to determine if it's justified.
See our latest analysis for SPML Infra
How Has SPML Infra Performed Recently?
With revenue growth that's exceedingly strong of late, SPML Infra has been doing very well. Perhaps the market is expecting future revenue performance to dwindle, which has kept the P/S suppressed. Those who are bullish on SPML Infra will be hoping that this isn't the case, so that they can pick up the stock at a lower valuation.
We don't have analyst forecasts, but you can see how recent trends are setting up the company for the future by checking out our free report on SPML Infra's earnings, revenue and cash flow.Is There Any Revenue Growth Forecasted For SPML Infra?
There's an inherent assumption that a company should underperform the industry for P/S ratios like SPML Infra's to be considered reasonable.
If we review the last year of revenue growth, the company posted a terrific increase of 100%. The latest three year period has also seen an excellent 64% overall rise in revenue, aided by its short-term performance. Accordingly, shareholders would have definitely welcomed those medium-term rates of revenue growth.
This is in contrast to the rest of the industry, which is expected to grow by 12% over the next year, materially lower than the company's recent medium-term annualised growth rates.
With this information, we find it odd that SPML Infra is trading at a P/S lower than the industry. It looks like most investors are not convinced the company can maintain its recent growth rates.
What We Can Learn From SPML Infra's P/S?
Despite SPML Infra's share price climbing recently, its P/S still lags most other companies. Typically, we'd caution against reading too much into price-to-sales ratios when settling on investment decisions, though it can reveal plenty about what other market participants think about the company.
We're very surprised to see SPML Infra currently trading on a much lower than expected P/S since its recent three-year growth is higher than the wider industry forecast. When we see strong revenue with faster-than-industry growth, we assume there are some significant underlying risks to the company's ability to make money which is applying downwards pressure on the P/S ratio. It appears many are indeed anticipating revenue instability, because the persistence of these recent medium-term conditions would normally provide a boost to the share price.
Plus, you should also learn about these 4 warning signs we've spotted with SPML Infra (including 2 which are a bit concerning).
If you're unsure about the strength of SPML Infra's business, why not explore our interactive list of stocks with solid business fundamentals for some other companies you may have missed.
New: Manage All Your Stock Portfolios in One Place
We've created the ultimate portfolio companion for stock investors, and it's free.
• Connect an unlimited number of Portfolios and see your total in one currency
• Be alerted to new Warning Signs or Risks via email or mobile
• Track the Fair Value of your stocks
Have feedback on this article? Concerned about the content? Get in touch with us directly. Alternatively, email editorial-team (at) simplywallst.com.
This article by Simply Wall St is general in nature. We provide commentary based on historical data and analyst forecasts only using an unbiased methodology and our articles are not intended to be financial advice. It does not constitute a recommendation to buy or sell any stock, and does not take account of your objectives, or your financial situation. We aim to bring you long-term focused analysis driven by fundamental data. Note that our analysis may not factor in the latest price-sensitive company announcements or qualitative material. Simply Wall St has no position in any stocks mentioned.
About NSEI:SPMLINFRA
Proven track record with adequate balance sheet.
Similar Companies
Market Insights

Advertisement
Community Narratives
Finding The True Value Of A Logistics Powerhouse
Fair Value US$95.21|8.4% undervalued
NV
Community Contributor
Paradigm Biopharmaceuticals Will Lead Osteoarthritis Treatment with Zilosul's FDA Success
Fair Value AU$5.50|92.1% undervalued
AM
Community Contributor
Barrick Mining (ABX:CA): A Gold Hedge against a U.S. Shutdown
Fair Value CA$60.00|24.2% undervalued
GM
Community Contributor