
Advertisement
- India
- /
- Construction
- /
- NSEI:SEPC
SEPC Limited's (NSE:SEPC) 27% Dip Still Leaving Some Shareholders Feeling Restless Over Its P/SRatio
SEPC Limited (NSE:SEPC) shares have had a horrible month, losing 27% after a relatively good period beforehand. Looking back over the past twelve months the stock has been a solid performer regardless, with a gain of 25%.
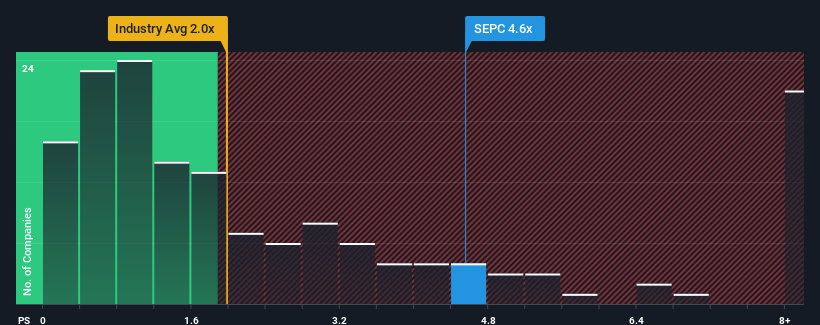
Although its price has dipped substantially, given around half the companies in India's Construction industry have price-to-sales ratios (or "P/S") below 2x, you may still consider SEPC as a stock to avoid entirely with its 4.6x P/S ratio. Although, it's not wise to just take the P/S at face value as there may be an explanation why it's so lofty.
Check out our latest analysis for SEPC
What Does SEPC's Recent Performance Look Like?
With revenue growth that's exceedingly strong of late, SEPC has been doing very well. The P/S ratio is probably high because investors think this strong revenue growth will be enough to outperform the broader industry in the near future. If not, then existing shareholders might be a little nervous about the viability of the share price.
We don't have analyst forecasts, but you can see how recent trends are setting up the company for the future by checking out our free report on SEPC's earnings, revenue and cash flow.Do Revenue Forecasts Match The High P/S Ratio?
SEPC's P/S ratio would be typical for a company that's expected to deliver very strong growth, and importantly, perform much better than the industry.
If we review the last year of revenue growth, the company posted a terrific increase of 69%. Still, revenue has fallen 6.1% in total from three years ago, which is quite disappointing. Therefore, it's fair to say the revenue growth recently has been undesirable for the company.
Comparing that to the industry, which is predicted to deliver 12% growth in the next 12 months, the company's downward momentum based on recent medium-term revenue results is a sobering picture.
In light of this, it's alarming that SEPC's P/S sits above the majority of other companies. Apparently many investors in the company are way more bullish than recent times would indicate and aren't willing to let go of their stock at any price. There's a very good chance existing shareholders are setting themselves up for future disappointment if the P/S falls to levels more in line with the recent negative growth rates.
The Key Takeaway
SEPC's shares may have suffered, but its P/S remains high. We'd say the price-to-sales ratio's power isn't primarily as a valuation instrument but rather to gauge current investor sentiment and future expectations.
Our examination of SEPC revealed its shrinking revenue over the medium-term isn't resulting in a P/S as low as we expected, given the industry is set to grow. With a revenue decline on investors' minds, the likelihood of a souring sentiment is quite high which could send the P/S back in line with what we'd expect. Unless the the circumstances surrounding the recent medium-term improve, it wouldn't be wrong to expect a a difficult period ahead for the company's shareholders.
It is also worth noting that we have found 2 warning signs for SEPC (1 doesn't sit too well with us!) that you need to take into consideration.
Of course, profitable companies with a history of great earnings growth are generally safer bets. So you may wish to see this free collection of other companies that have reasonable P/E ratios and have grown earnings strongly.
New: Manage All Your Stock Portfolios in One Place
We've created the ultimate portfolio companion for stock investors, and it's free.
• Connect an unlimited number of Portfolios and see your total in one currency
• Be alerted to new Warning Signs or Risks via email or mobile
• Track the Fair Value of your stocks
Have feedback on this article? Concerned about the content? Get in touch with us directly. Alternatively, email editorial-team (at) simplywallst.com.
This article by Simply Wall St is general in nature. We provide commentary based on historical data and analyst forecasts only using an unbiased methodology and our articles are not intended to be financial advice. It does not constitute a recommendation to buy or sell any stock, and does not take account of your objectives, or your financial situation. We aim to bring you long-term focused analysis driven by fundamental data. Note that our analysis may not factor in the latest price-sensitive company announcements or qualitative material. Simply Wall St has no position in any stocks mentioned.
About NSEI:SEPC
SEPC
Provides integrated design, engineering, procurement, construction, and project management services in India and internationally.
Adequate balance sheet with questionable track record.
Similar Companies
Market Insights

Advertisement
Community Narratives
MINISO's fair value is projected at 26.69 with an anticipated PE ratio shift of 20x
Fair Value US$24.03|11.0% undervalued
BE
Community Contributor
Procter & Gamble: A Dividend Giant Facing Slowing Growth
Fair Value US$119.81|23.3% overvalued
AN
Community Contributor
Eli Lilly's Future Growth Driven by Tirzepatide and Favorable Market Conditions
Fair Value US$1.19k|13.8% undervalued
EA
Community Contributor